ICT Core Content Notes All Month Free Download PDF
ICT Core Content Month 1 (Element of a Trade Setup) Notes
Month 1 of ICT Core Content Mentorship Elements of a Trade Setup, provides a structured approach to analyzing market behavior and anticipating potential moves based on the context or framework surrounding the price action and institutional order flow.
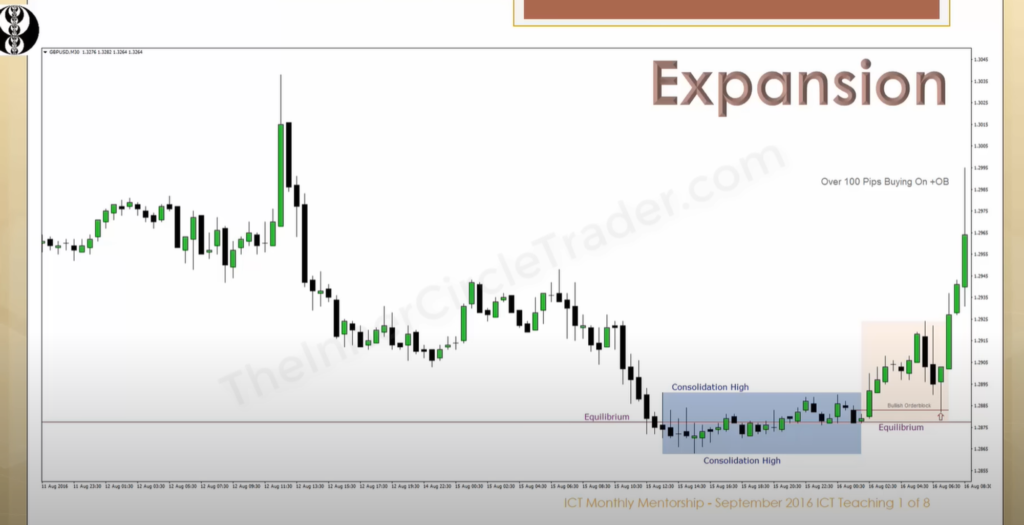
What is Expansion?
Expansion occurs when the price rapidly moves away from a level of equilibrium (50% of fib), indicating strong activity—either entries or exits—from major market participants. This phase is critical as it often sets the stage for significant future movements and can indicate the start of a new trend.
What is Retracement?
Following a strong movement, retracement is a natural part of the market’s ebb and flow. It involves a partial reversal or pullback to key price levels, which were previously established. This phase is crucial for traders looking to enter the market at a more favorable price point after a sharp move.

What is Reversal?
A reversal marks a complete directional change in the market’s movement. This phase can indicate a major shift in market sentiment or strategic institutional maneuvers, offering opportunities for traders to capitalize on the new trend.

What is Consolidation?
Often overlooked by novices, consolidation is where the market pauses and moves within a bounded range. This phase indicates a period of indecision or order building, which often precedes significant price movements. Recognizing consolidation can help traders prepare for the next breakout or breakdown.

Institutional Order Flow and Reference Points
Understanding institutional order flow is key to identifying potential entry and exit points. Institutions often leave footprints in the form of:
What are Order blocks?
These are levels where institutional traders have historically entered or exited significant positions, likely to serve as future support or resistance zones.
FVG and Liquidity Voids
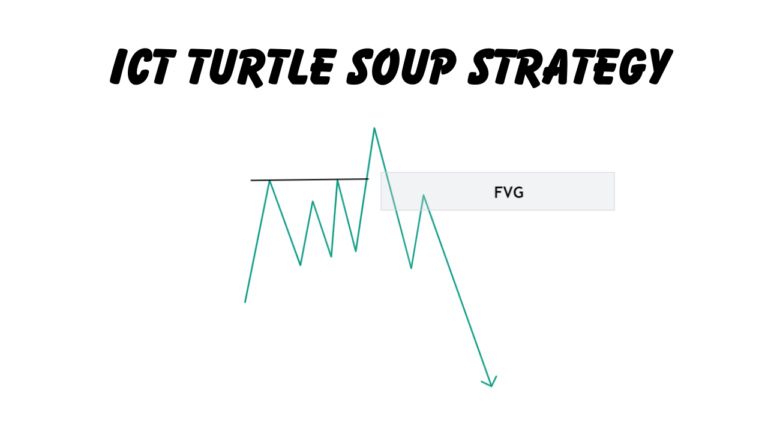
Fair Value Gaps (FVG) and liquidity voids are areas where trading has been thin, presenting opportunities for price to move rapidly once these gaps are filled.
Liquidity Pools and Stop Runs
These are areas heavily populated with stop-loss orders. A trigger in these zones can lead to sharp price spikes or drops, providing quick profit opportunities or risks.
Equilibrium
Identifying the equilibrium price helps traders understand the balance between supply and demand, often found at the midpoint of a consolidation range.
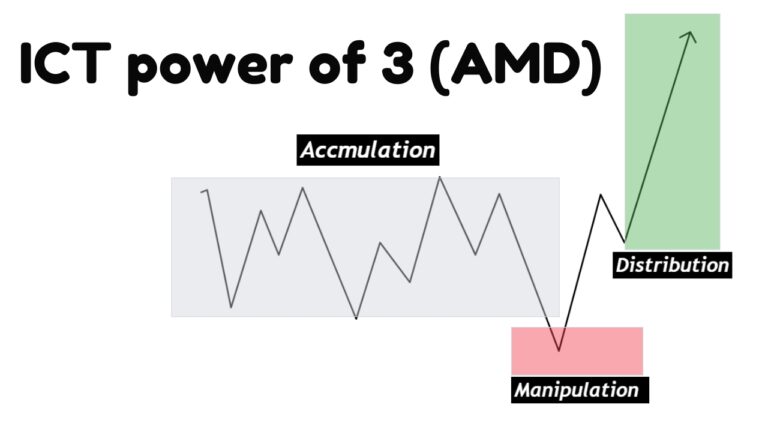
Market movements typically start from a consolidation phase, where orders accumulate. From here, an expansion or impulse swing can initiate, leading to either a return to consolidation or a move into retracement. Following an expansion, the market might transition into a reversal pattern, which after playing out, leads back to retracement and eventually, consolidation.
Traders need to be adept at reading these signs and understanding the current market phase to make strategic decisions. Recognizing whether the market is in expansion, retracement, reversal, or consolidation can dictate whether to trade actively or wait for more clarity.
What Doesn’t Happen
- Consolidation doesn’t directly lead to Reversal:
- It’s uncommon for the market to switch directions completely without first showing some expansion.
- Consolidation doesn’t lead directly to Retracement:
- Prices don’t typically pull back unless there has been a prior expansion.
- Consolidation doesn’t lead to another Consolidation without Expansion:
- The market doesn’t move from one quiet phase to another without a significant price movement in between.
Summary of Month 1
- Market Movements Start from Consolidation:
- Orders accumulate during this phase.
- Market prepares for a breakout or breakdown.
- Expansion or Impulse Swing:
- Initiated after consolidation.
- Leads to significant price movement indicating the start of a new trend or continuation of an existing one.
- Possible Outcomes Post-Expansion:
- Return to consolidation: Market may stabilize and trade within a narrow range again.
- Move into retracement: Partial reversal or pullback to previously established key levels.
- Transition into Reversal:
- Following an expansion, the market may enter a reversal phase.
- Indicates a complete change in the market’s direction.
- Cycle Completion:
- After a reversal plays out, it leads to retracement.
- Eventually, the market returns to consolidation, restarting the cycle.
- What Doesn’t Happen
- Consolidation doesn’t directly lead to Reversal:
- It’s uncommon for the market to switch directions completely without first showing some expansion.
- Consolidation doesn’t lead directly to Retracement:
- Prices don’t typically pull back unless there has been a prior expansion.
- Consolidation doesn’t lead to another Consolidation without Expansion:
- The market doesn’t move from one quiet phase to another without a significant price movement in between.
Core Content Mont 2 (Growing a Small Account)Notes
When it comes to growing small trading accounts, it’s essential to follow disciplined trading strategies that focus on long-term growth rather than quick gains.
What You Need to Avoid
- Avoid rushing for massive gains: Whether it’s a large number of pips or high percentage returns, quick gains often lead to high risks.
- Avoid large risks for large returns: Exposing your account to large risks in hopes of large profits can lead to significant losses.
- Avoid underestimating small risk trades: Small risk trades can effectively contribute to account growth; don’t overlook them.
- Avoid poor planning: Sacrificing your trading equity due to lack of planning or poor strategies can deplete your account.
What You Need to Aim For
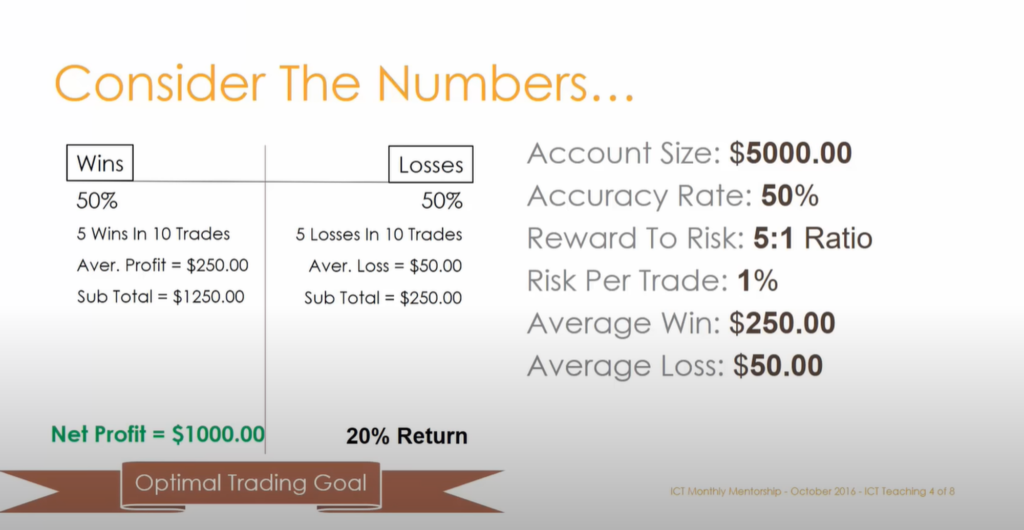
- Aim for a favorable reward-to-risk ratio: Determine how to realistically anticipate and achieve a favorable balance between potential rewards and associated risks.
- Focus on risk management: Learn to respect and prioritize the risk aspect of trades over the potential rewards to ensure sustainable trading.
- Look for high reward-to-risk trade setups: Identify trade setups that offer a potential of three times reward to one part risk or higher.
- Plan for minimal impact from losses: Frame your trades in a way that they have little negative impact if they turn out to be unprofitable.
Key Points to Consider
- Allow time for compounding: Compounding interest plays a crucial role in growing accounts over time; patience is key.
- Selective trading: It doesn’t take many trades to achieve significant returns like 50% in a month, but it requires highly selective and strategic trading.
- Monitor and minimize drawdowns: Pay close attention to drawdowns as they are critical. Aim to avoid substantial drops in your account’s value.
- Target a reasonable monthly growth: Focusing on achieving about 6% growth of your equity per month can lead to sustainable progress.
Effectively managing risk is critical in trading, especially when the aim is to build a robust and profitable portfolio with minimal exposure to potential losses.
Focus on Higher Time Frames
Why it matters: Trading based on higher time frame charts (like daily, weekly, or monthly) is ideal because these provide a clearer picture of the market trends and are less influenced by minor fluctuations.
Align with Institutional Analysis
Why it matters: Major institutions and banks typically analyze markets on a daily, weekly, and monthly basis. Aligning your trading decisions with these can lead to more consistent results.
Locate Key Price Level’s
Why it matters: Identifying price levels that coincide with institutional order flow is crucial. These levels are often significant for market movements and can guide entry and exit points.
Take Advantage of the Slower Pace
Why it matters: Higher time frame setups tend to form more slowly, giving traders ample time to plan and react without the pressure of rapid changes.
B. Strategies to Lower Risk in Trades
Leverage the Influence of Higher Time Frames
Why it matters: Since higher time frames have a greater influence on overall market direction, focusing on these can enhance the reliability of your trade decisions.
Refine Conditions from High to Low Time Frames
Why it matters: Conditions identified on a higher time frame (HTF) can be refned and verified on a lower time frame (LTF), providing a detailed view and confirming the viability of the trade setup.
Transpose Levels to Lower Time Frames
Why it matters: By transposing the significant levels identified on HTF to LTF charts, you can fine-tune entry points and better manage trades.
Refine HTF Levels on LTF for Smaller Stops
Why it matters: This strategy allows for tighter stop-loss placements, reducing the risk per trade. By refining HTF levels to LTF, you can enhance precision in stop placement, leading to minimized potential losses.
ICT Core Content Notes – Month 3
ICT Month 3 of core content deal with the selection of time frames and discuss how to make your own trading model.
Timeframe Selection for Trading
Choosing the right timeframe for trading is essential as it dictates the trading style, the type of analysis used, and the potential risks and rewards involved. Here’s a breakdown:
- Monthly Charts (Position Trading):
- Usage: These charts are best suited for position trading, where trades are held for several months to a few years.
- Advantages: They provide a broad view of the market trends and are less affected by short-term volatility.
- Strategy: Traders look for major economic trends and cycles, focusing on long-term profitability.
- Weekly Charts (Swing Trading):
- Usage: Ideal for swing trading, where positions are held from several days to several weeks.
- Advantages: They strike a balance between capturing significant market movements and reducing the exposure to daily market noise.
- Strategy: Traders use these charts to catch ‘swings’ in market prices within primary trends.
- Daily Charts (Short Term Trading):
- Usage: Suitable for short-term trading strategies where trades may last from a day to a few weeks.
- Advantages: Daily charts offer more detail on market movements and can provide opportunities for quicker profits than longer timeframes.
- Strategy: Traders look for shorter cycles and quicker changes in market sentiment.
- 4 Hour or Less (Day Trading):
- Usage: These timeframes are used primarily for day trading, where all positions are closed before the market closes.
- Advantages: Allows traders to capitalize on intra-day market movements without the risk of significant overnight price changes.
- Strategy: Day traders need to be reactive and manage trades actively, making decisions based on hours or minutes.
Defining Setups For Your Model
Different trading strategies require different setups based on the chosen timeframe:
- Trend Trader:
- Approach: Focuses on trading in the direction of the trend identified on monthly and weekly charts.
- Objective: To maximize gains from large movements by aligning with the market’s overall direction.
- Method: Utilizes indicators and tools to confirm trend strength and potential continuations.
- Swing Trader:
- Approach: Trades intermediate-term price actions identified on daily charts.
- Objective: To capture gains from market swings within a predominant trend.
- Method: Looks for technical patterns or signals indicating short-term reversals or continuation of trends.
- Contrarian Trader:
- Approach: Focuses on identifying and trading reversal patterns at market extremes.
- Objective: To profit from potential market turnarounds where others might not see it coming.
- Method: Uses overbought or oversold indicators, divergences, and sentiment analysis.
- Short Term Trader:
- Approach: Trades the weekly ranges for short durations (1-5 days).
- Objective: To take advantage of market volatility within a defined short period.
- Method: Relies on breakout strategies and quick responses to market news or economic events.
- Day Trader:
- Approach: Intraday swing trading with all positions closed by 2:00 PM New York time to avoid overnight risks.
- Objective: To secure profits from day-to-day price fluctuations.
- Method: Employs a mix of technical analysis, scalping, and possibly algorithmic trading tools.
ICT Core Content Notes – Month 4 Impact of Interest Rates
Mont 4 of ICT core content teaches how interest rates affect currency trades and the strategic implications of using interest rate analysis in forex trading.
A. Smart Money Accumulation & Distribution
This concept revolves around the strategic movements of institutional investors and central banks, collectively known as “Smart Money.”

Dominant Influence of Interest Rates:
Interest rates are fundamentally the most influential factors in forex markets because they determine the return investors can expect on the currencies they hold. Higher interest rates offer higher returns on investments denominated in that currency, making it more attractive. This can lead to an increase in the value of that currency as demand rises.
Interpreting Interest Rate Shifts:
Traders must understand both why interest rates change and how such changes can affect currency values. This involves monitoring central bank communications, policy meetings, and economic indicators that might influence these decisions. For example, if a central bank raises interest rates to combat inflation, the currency might strengthen due to increased foreign investment.
Technical Analysis of Interest Rates:
Technical analysis involves using historical interest rate data to predict future trends. By charting past interest rate changes and their impacts on currency values, traders can identify patterns that may repeat under similar circumstances. This analysis helps in predicting market movements and planning trades accordingly.
B. Interest Rate Triads
Interest Rate Triads focus on the relationship between different segments of the bond market, which reflect varying investor expectations over different time horizons. Here’s a detailed exploration:
30-Year Bond – Long-Term Rate:
The 30-year bond yield reflects long-term economic expectations and investor confidence. Changes in this rate can indicate shifts in long-term economic outlooks, such as expectations for growth, inflation, and fiscal policy.
10-Year Note – Intermediate-Term Rate:
The 10-year note is a critical benchmark that influences various economic factors, including mortgage rates and other long-term financial commitments. It’s particularly watched for signs of investor sentiment about medium-term economic prospects.
5-Year Note – Short-Term Rate:
This rate reacts more to immediate economic changes and can be quite volatile. It provides insights into the market’s short-term outlook and is often used by traders for speculative moves based on upcoming economic data releases or policy changes.
Overlaying and Comparative Analysis:
By overlaying these rates or comparing their movements, traders can analyze the yield curve—a graph that plots interest rates at a set point in time of bonds having equal credit quality but differing maturity dates. The shape of the yield curve helps in understanding economic expectations; for instance, a flattening curve might suggest a slowing economy.

Capitalizing on Failure Swings:
Opportunistic times arise when the market’s expectations for interest rates fail to align with actual policy outcomes. These moments can lead to significant price movements as the market adjusts to new information. Identifying these failure swings can provide high-reward opportunities for traders who can correctly anticipate directional shifts in currency values.
By integrating these analyses, forex traders can refine their strategies, aligning them not just with current market conditions but also with predictive insights into future economic and policy shifts. This comprehensive approach allows traders to position themselves effectively in a competitive forex environment, leveraging interest rate insights for smarter, strategic trading decisions.