ICT Power of 3 (AMD) Accumulation, Manipulation & Distribution
The ICT Power of 3 is a trading strategy developed by Inner Circle Trader (ICT), Michael Huddleston. This strategy is based on understanding how smart money, such as institutional investors, manipulates the market to trap retail traders, hunt their stop losses, and move the market in their desired direction.
By mastering the ICT Power of 3 concept, traders can plan and execute their trades more effectively by following the footprints of smart money. In this blog post, you will learn about the three key phases: Accumulation, Manipulation, and Distribution.
What is Accumulation?
Accumulation is a phase in the market where large investors, often called “smart money” or institutions, start buying a significant amount of an asset (like a stock) without causing a big increase in its price.
During this phase, the asset’s price usually moves in a narrow range, going up and down within a certain level, instead of trending strongly up or down.
By understanding accumulation, new traders can better identify when large investors are quietly building positions, which often leads to future price increases.
What is Manipulation?
Manipulation in trading is when large investors, or institutions, intentionally influence the market to trick individual traders (retail traders) stop loss. The main goal of manipulation is to trigger the stop-loss orders that retail traders have set, and then move the price in the opposite direction to make a profit.
Stop-Loss Hunting: Smart money targets the price levels where retail traders have placed their stop-loss orders. These are automatic orders to sell or buy when the price hits a certain point.
What Are Common Areas for Stop-Loss Orders?
Retail traders often place their stop-loss orders around certain key levels in the market:
Previous Day’s Low and High: The lowest and highest prices of the previous trading day.
Previous Trading Session’s Low and High: The lowest and highest prices of the last completed trading session.
Equal Lows and Equal Highs: Price levels where the market has previously tested multiple times without breaking. These are seen as strong support and resistance levels.
Retail traders place stop-loss orders around these areas to protect their investments, aiming to limit potential losses if the price moves against them.
Reversing the Price: Once the stop-loss orders are triggered and retail traders are forced out of their positions, smart money reverses the price direction to profit from the change.
What is Distribution in ICT Power of 3?
In ICT PO3, distribution happens when prices move after a stop-loss hunt. Smart traders clear out the stop-loss orders of retail traders, then move the price where they want it to go. This price movement is called distribution.
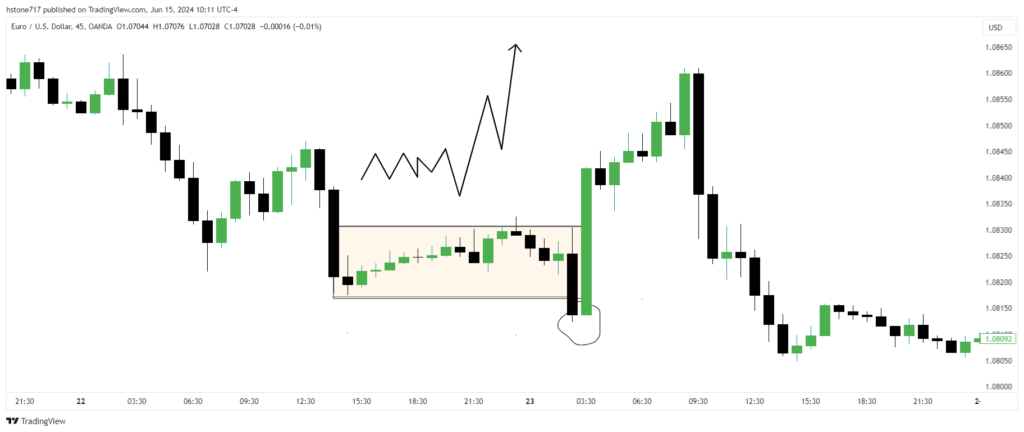
Bullish Power of Three Trading Stratgey
In a bullish scenario, smart money accumulates their orders near or just below the opening price. Then, they push the price down below old lows or the previous day’s lows to sweep up sell-side liquidity. This traps retail traders who think it’s a breakout and open their sell positions. Smart money then takes advantage by buying below the old low, setting up for a profitable upward move.
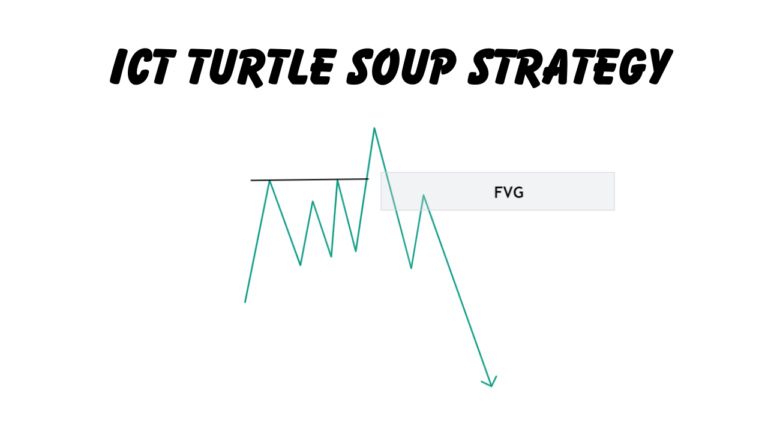
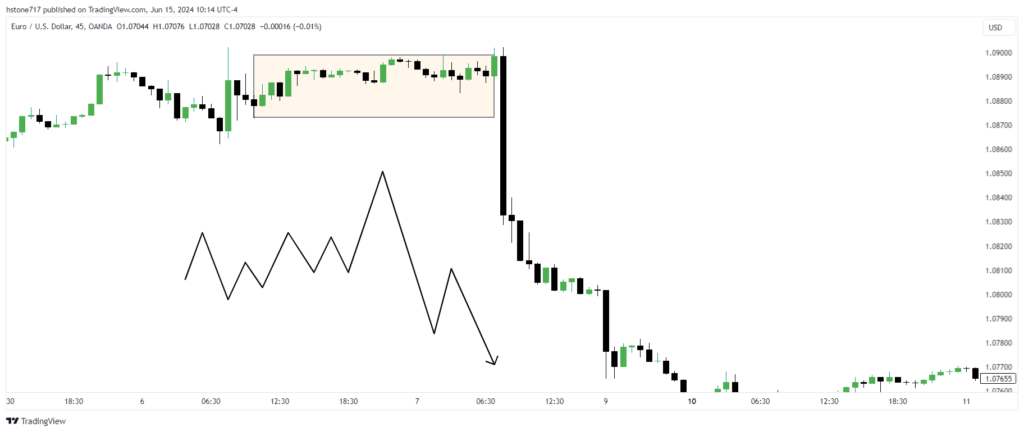
ICT Bearish PO3
The market moves sideways, with prices accumulating near the opening price. Smart money is selling their positions in this area.
Manipulation Phase: Suddenly, prices spike above the range, creating liquidity by triggering buy orders from uninformed traders. Retail traders often see this as a breakout and buy the asset.
Decline Phase: After creating this false sense of a breakout, smart money sells aggressively, pushing prices down. The price falls quickly, marked by strong bearish candles.
How to trade power of 3?
To improve the readability of the text, here’s a revised version:
The Trading Power of 3 concept, coupled with an ICT strategy, demands a daily bias. For instance, if you anticipate a bullish day, wait for the market to sell side liquidity and move in the direction of your forecast.
Look for price retracements and consider using OTE or FVG for trade entry. Avoid trading against your daily direction, which you establish at the beginning of each trading week. This direction reflects the true trend of weekly and monthly candles.