ICT Candle Range Theory (CRT)
Introduction to Candle Range Theory and Its Relevance in Trading
In the world of trading, understanding price action is crucial for making informed decisions. One effective way to grasp price movements is through Candle Range Theory. This theory highlights that every candlestick, regardless of its timeframe, represents a range of price action. By analyzing this range on lower timeframes, traders can gain insights into market behavior and predict potential price movements more accurately.
CRT is particularly relevant for traders who employ strategies based on price action and market structure. It provides a framework for identifying key phases in price movement: Accumulation, Manipulation, and Distribution (AMD).
By mastering Candle Range Theory, traders can enhance their ability to read the market, improve their timing for entries and exits, and ultimately increase their chances of trading success.
What is Candle Range Theory?
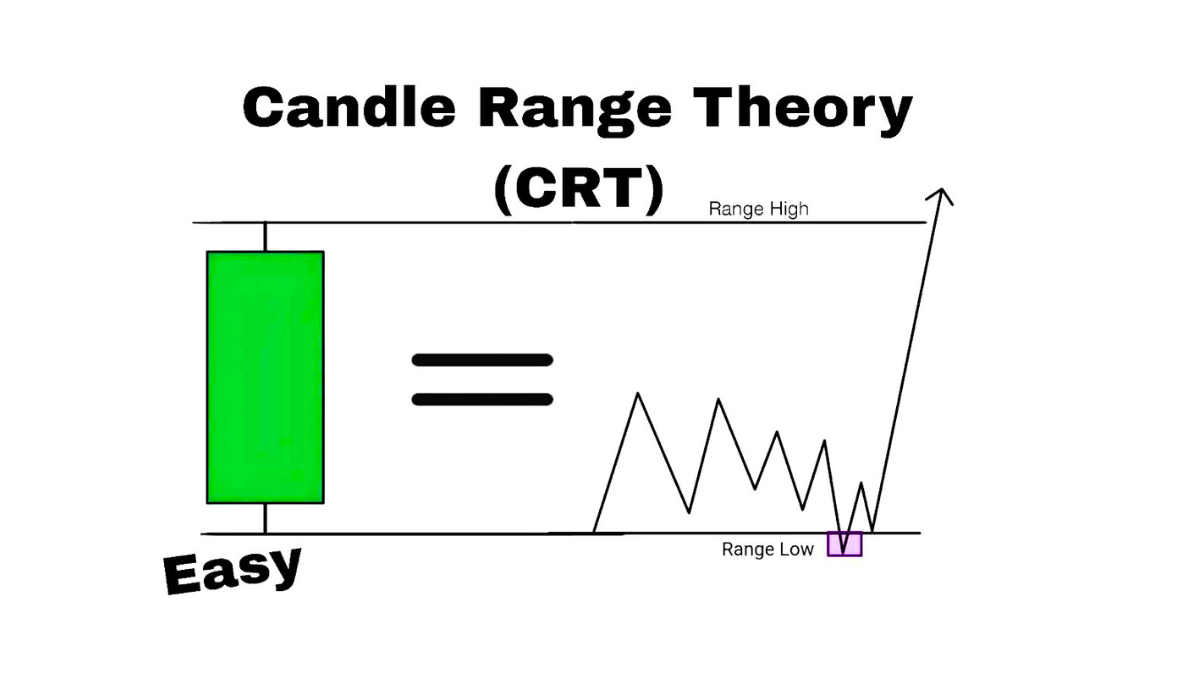
Candle Range Theory is a trading idea that each candlestick as a range of price movement. According to this theory, every candlestick, no matter the timeframe, captures a specific range of price changes. Understanding this range can give traders useful clues about future price movements.
Candle as a Range:
Each candlestick, whether it’s for a minute, an hour, a day, or any other timeframe, shows a range of price action from the open to the close, including the highest and lowest prices during that period.
This range shows the battle between buyers and sellers during that timeframe.
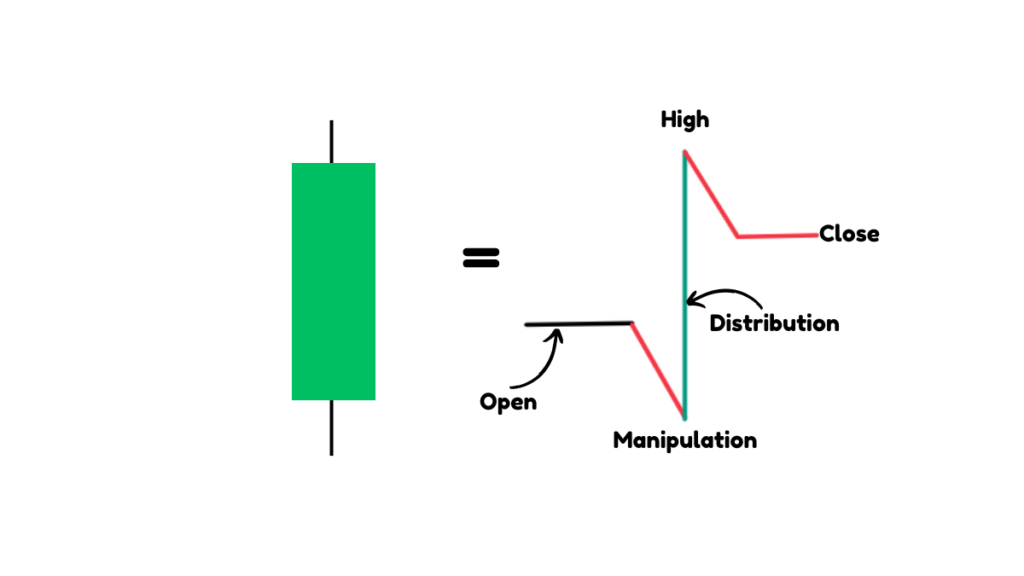
Lower Timeframe Analysis:
By looking at a single candlestick on a lower timeframe, traders can see the detailed price movements within that range.
This helps traders spot patterns and phases like sideways movement (accumulation), false breakouts (manipulation), and true directional moves (distribution).
Learn ICT PO3 for more understanding Accumulation, Manipulation and Distribution.
CRT Trading Strategy
When Expected Bullish Scenario
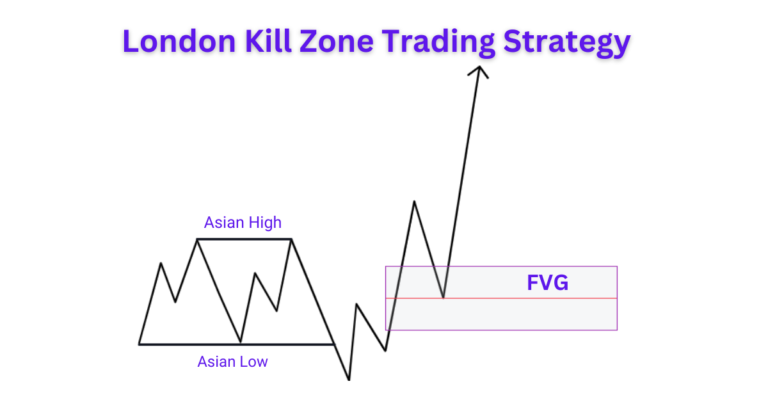
If you expect the price to rise (bullish trend), look for a period of sideways movement, known as accumulation, near the opening of the larger candle. After spotting accumulation, wait for the price to dip below the low of the larger candle. This dip, called manipulation, clears out stop-loss orders and gathers liquidity.
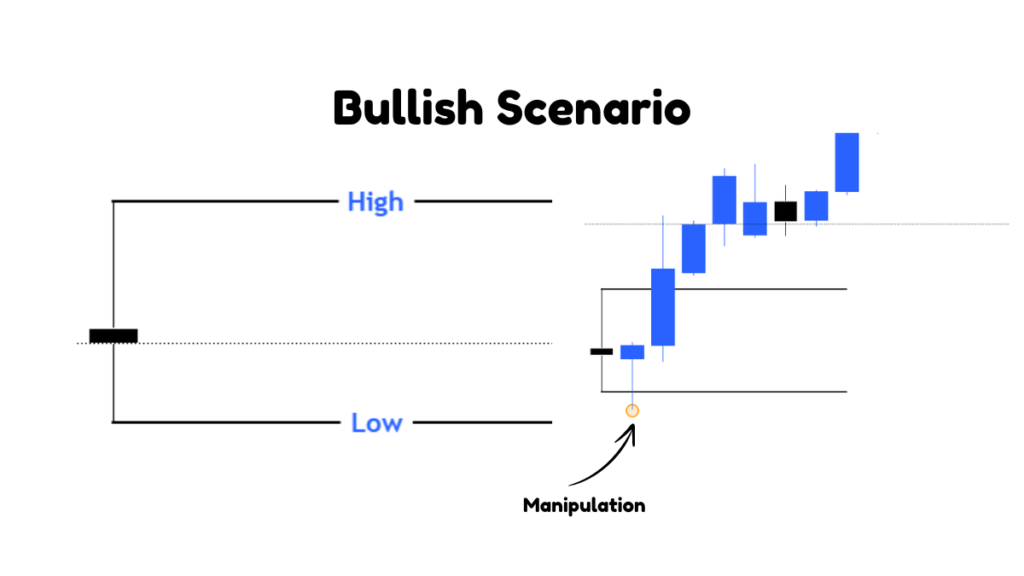
Once this liquidity sweep happens, the price will start moving in the expected direction.
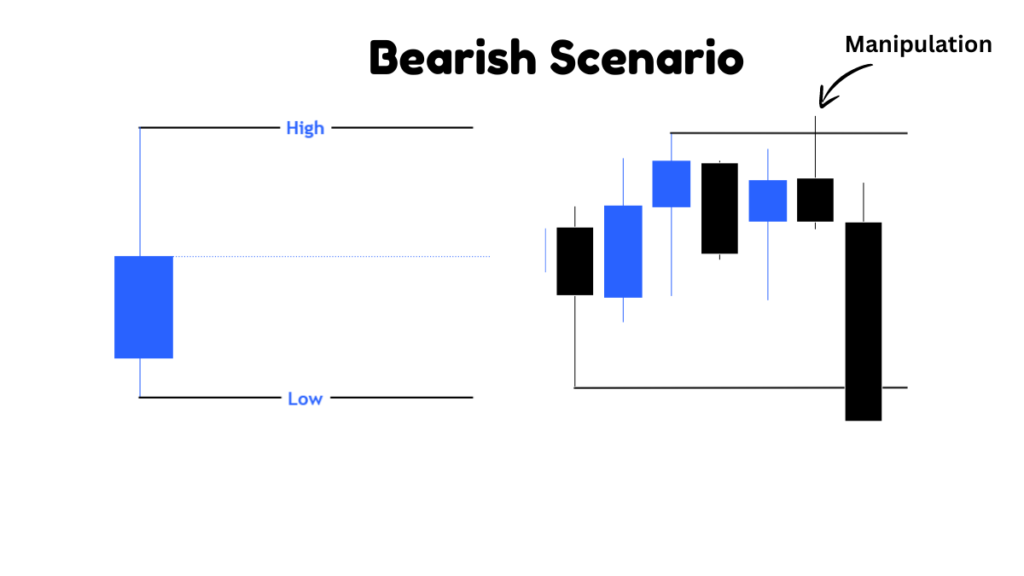
When Expected Bearish Scenario
If you expect the price to fall (bearish trend), look for a period of sideways movement, known as accumulation, near the opening of the larger candle. After spotting accumulation, wait for the price to rise above the high of the larger candle. This rise, known as manipulation, triggers stop-loss orders and gathers liquidity.