How to find Valid ICT Market Structure Shift (MSS)
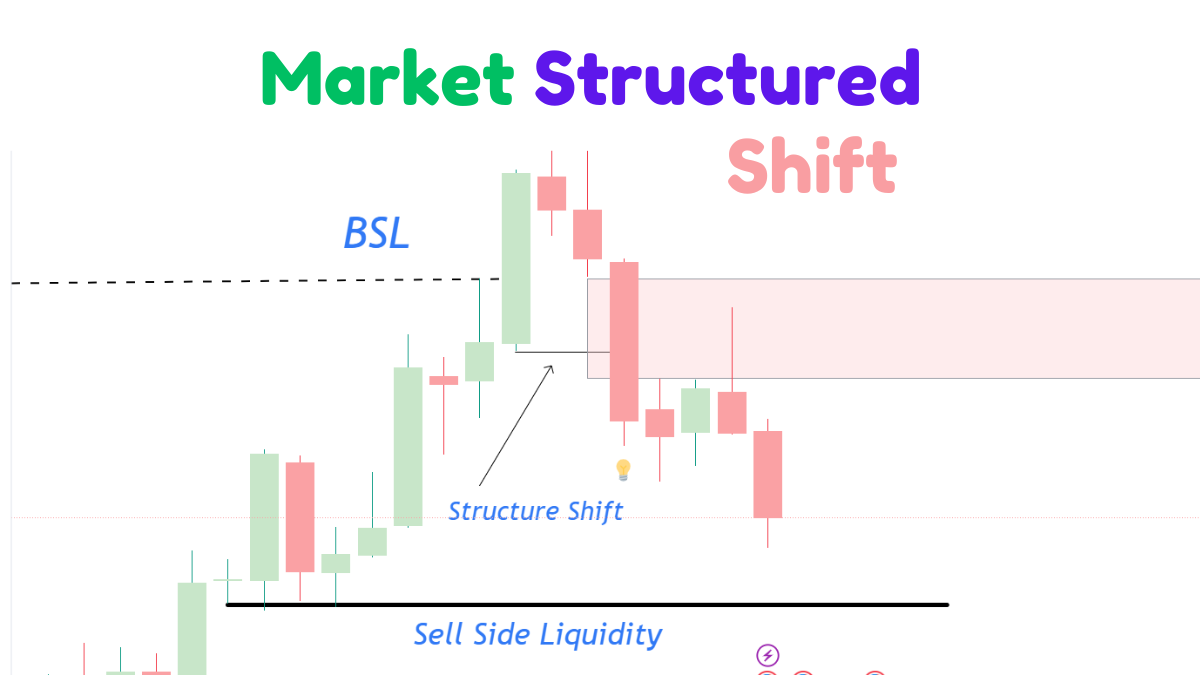
ICT Market Structure Shift occurs when prices goes beyond old lows and old highs for liquidity sweep and break the higher high or higher low with impulsive movement.
New traders often struggle to identify a valid market structure shift. In this blog post, we will explore what constitutes a valid shift in market structure and provide complete strategy to trade ICT MSS effectively.
What is Shift In Market Structure?
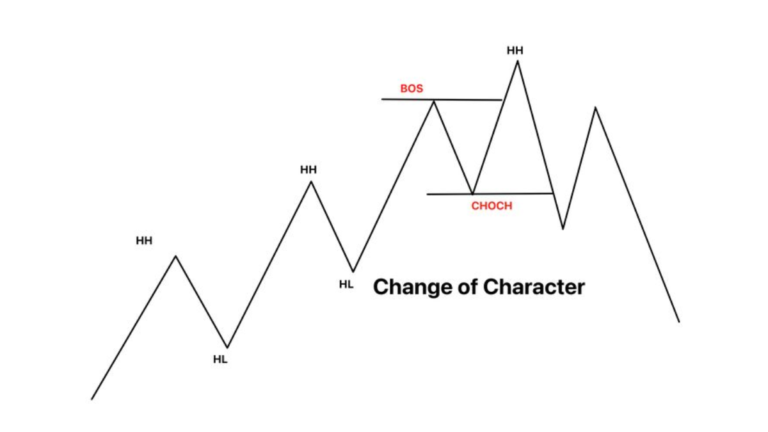
A shift in market structure (MSS) occurs when the market changes direction with an impulsive move.
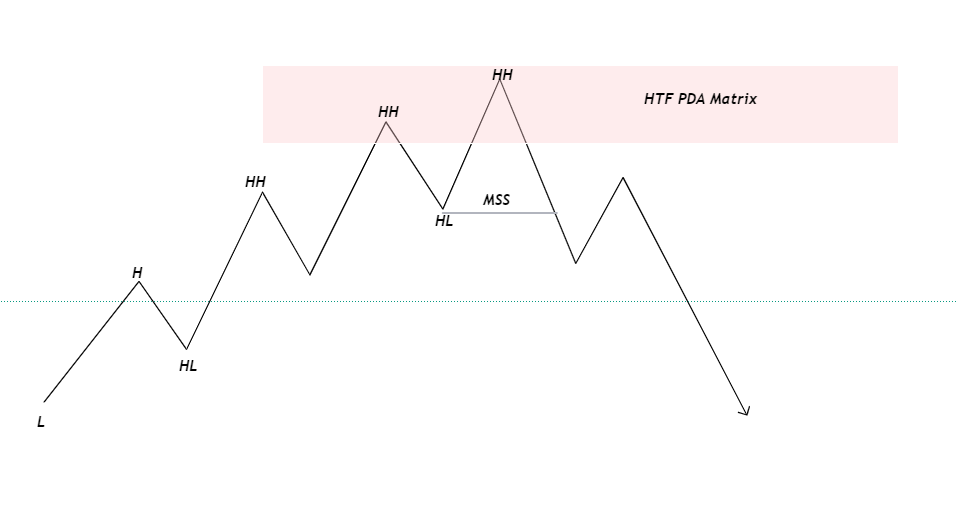
For instance, if the market is trending downward by consistently making lower lows, and it reaches a higher time frame (PDA), it may then change direction. This directional change, characterized by an impulsive movement or displacement, is referred to as a market structure shift (MS).
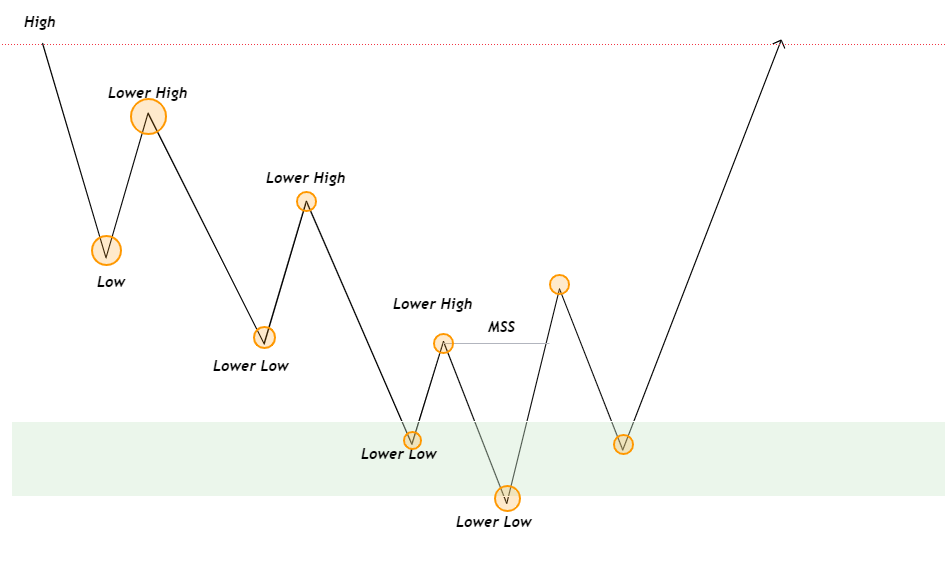
Above image illustrate the shift in the market structure. Market goes down by making lower low when reaching higher time frame premium and discount array matrix (PDA) after sweeping liquidity price changes its direction and break the recent lower high with impulsive movement known as MSS.
What is Bullish MSS
The shift in the market structure occurs when price changes its direction from bearish or down trend toward the uptrend(bullish)
What is Bearish Market Structure Shift?
Bearish marker structure is when price break the previous higher low with impulsive movement after reaching on higher time frame point of interest .
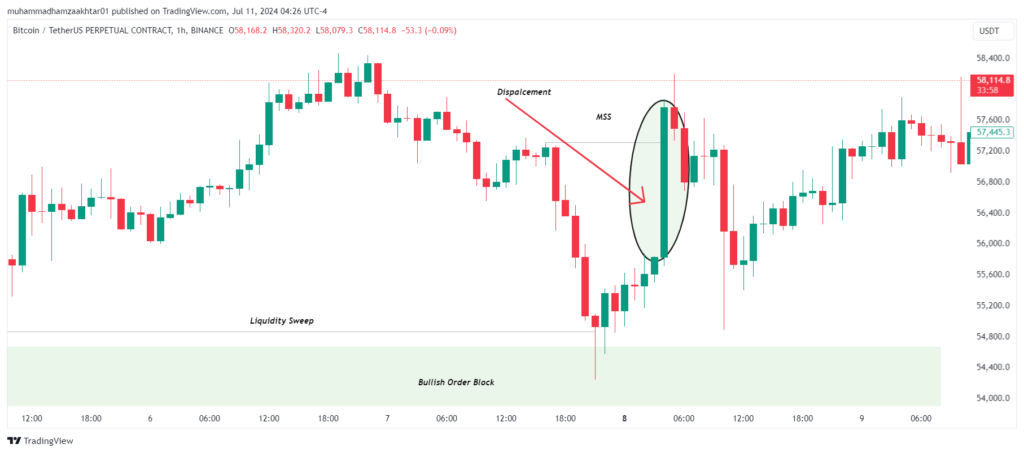
Example of MSS in BTCUSD
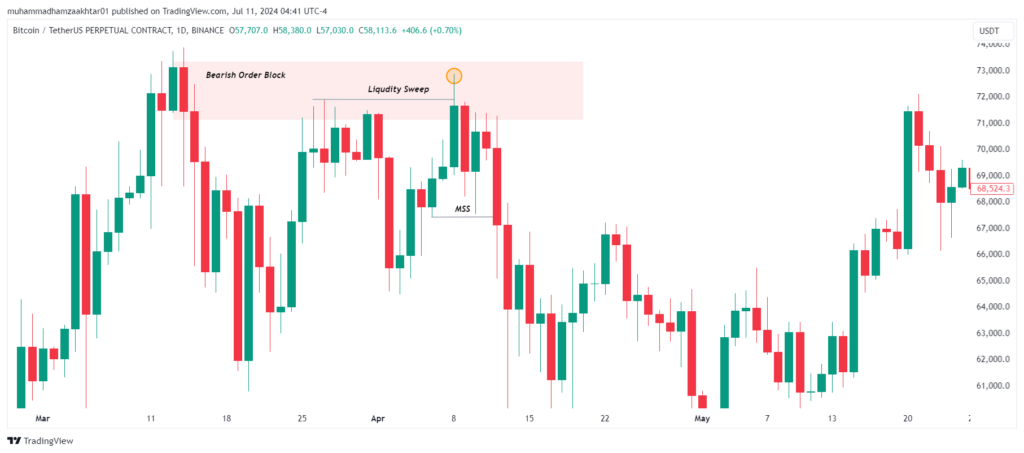
The above chart of BTCUSD show the shift in market structure from bullish to bearish.
Trading Strategy
To trade a shift in market structure (MSS), follow these steps:
- Identify Higher Time Frame PD Arrays: Wait for the price to reach higher time frame points of demand (PD) arrays, such as order blocks and fair value gaps.
- Look for Liquidity Sweeps: Monitor for the price to move beyond equal lows and equal highs, indicating a liquidity sweep.
- Observe Impulsive Movements: After the liquidity sweep, watch for an energetic movement that breaks the previous lower high or higher low, indicating a market structure shift.
- Switch to Lower Time Frames: Move to a lower time frame (e.g., 5-minute or 1-minute chart) to find imbalances or gaps.
- Wait for Price to Fill the Gap: Wait for the price to return and fill the identified gap. This is your opportunity to execute your trade.
By following these steps, you can effectively trade shifts in market structure with a strategic approach.

Helping Traders Scale to $10k/month in EUR/USD, GBP/USD, and E-mini S&P
With over 7 years of Forex market experience, Osama Asif is an expert in technical and fundamental analysis. Since 2024, he has been a key contributor to the ICT Trading platform. As a Certified Financial Risk Manager (FRM), Osama is passionate about precision and dedicated to guiding traders to achieve their financial goals in the Forex market.