
ICT 2024 Mentorship Notes Lecture-1
In the world of trading, time is the cornerstone of every price movement. It’s not just about what the market does, but when it does it. The 2024 ICT Mentorship kicks off by emphasizing that time dictates when and why price makes a significant move, whether it’s a displacement, a run, or a retracement.
Lecture-1 Summary ICT Mentorship 2024
- New Week Opening Gaps: Used as indicators of liquidity.
- Timeframes: Focus on the 1-minute, 5-minute, and 15-minute charts.
- Market Analysis: Search for Relative Equal Highs and Lows, and study how the market moves between Old Highs, Old Lows, and Fair Value Gaps.
- High Probability EQ Levels: Identifying these levels helps predict where the market may trade based on whether the left-side high/low is higher/lower than the right-side high/low.
- Bullish and Bearish Failure Swings: Visualized using W and M-shaped patterns to indicate potential price reversals.
- Market Smoothness: The strategy involves looking for smooth areas in the market, particularly before and during pre-market and opening ranges.
Why Time Matters ICT Mentorship 2024
Understanding that price delivers according to time is crucial. Without the element of time, price movements lose their meaning. Time is the foundation upon which every major price swing is built.
In this mentorship, ICT highlights key timeframes where the market’s actions are most telling:
- 7:00 AM
- 7:30 AM
- 8:00 AM
- 8:30 AM
- 9:00 AM
- 9:30 AM
These are the moments you should focus on when analyzing price action. For instance, New Week Opening Gaps often act as a magnet for liquidity. Always consider where the market is likely to head next, and pay close attention to how it moves between Old Highs, Old Lows, and inefficiencies.
Before 8:00 AM (and ideally before 8:30 AM), it’s essential to pinpoint where the highs and lows are on both the 1 Minute and 15 Minute charts.
What are some important timeframes
The mentorship focuses on three primary timeframes:
- 15 Minute
- 5 Minute
- 1 Minute
Each of these timeframes offers valuable insights, particularly when studying price at specific times of the day. For instance, the market often reaches for Old Highs, Old Lows, and Fair Value Gaps. Remember, seeing liquidity doesn’t necessarily mean the move is over; it’s more about understanding where the market might go next.
Identifying High-Probability Trading Zones
ICT teaches that there are certain high-probability zones where the market is likely to trade:
- High Probability EQ High: If the High on the left is higher than the High on the right (or during a failure swing), there’s a strong chance the market may trade above this level.
- High Probability EQ Low: If the Low on the left is lower than the Low on the right (or during a failure swing), the market is likely to trade above this point.
These concepts are tied to the idea of “Pining,” where the goal is to continuously create, inspire, or manipulate the expectations of a large number of investors. The bodies of the candles tell the story, while the wicks do the damage. Timing is everything; if it’s not the right time of day, this model simply won’t work.
The AM Session: A Time to Act
The AM session, starting at 7:00 AM (New York Time), is when you should begin searching for Relative Equal Highs and Lows. The idea is to look for where the market is smooth, particularly between:
- 7:00 – 7:30 AM
- 8:00 – 8:30 AM
- 9:00 – 9:30 AM
During these periods, the market’s “still waters” invite action.
Here’s how the session breaks down:
- 7:00 – 7:30 AM: Pre-Market Range
- 7:30 – 8:00 AM: Opening Range
- 9:00 – 9:30 AM: Pre-Market Range
- 9:30 – 10:00 AM: Opening Range
Before entering the Pre-Market Range, look for Relative EQ Highs and Lows. If you spot an Equal High and an Equal Low, observe which one gets disrupted first before taking a position. The sharks in the market will always target the “still water” of EQ Highs and Lows.
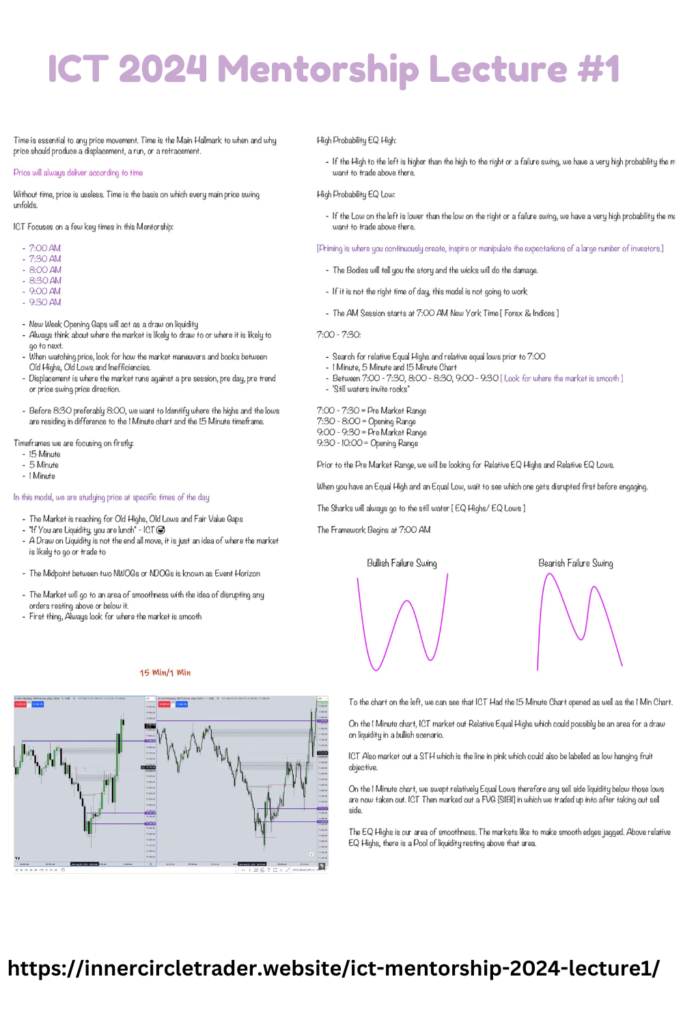
Failure Swings: Recognizing Market Patterns
The mentorship also introduces the concepts of Bullish and Bearish Failure Swings, represented by W-shaped and M-shaped patterns, respectively. These patterns indicate potential price reversals and are essential in spotting low-hanging fruit objectives in the market.
For example, on the 1 Minute chart, after identifying and sweeping relatively Equal Lows, the market may trade up into a Fair Value Gap (FVG). Above the relative EQ Highs, there is often a pool of liquidity, making these areas of smoothness critical for making informed trading decisions.