ICT Fair Value Gap Explained With Examples and Trading Strategy
ICT Fair Value Gap (FVG) refers to a price range where there is a significant imbalance in market liquidity, often visible on lower time frame charts. This gap occurs when the price moves rapidly away from a level with minimal trading activity, creating a noticeable gap on the chart. Essentially, an FVG creates a temporary vacuum in trading activity, resulting in an actual price gap.
Traders pay close attention to these gaps because these gap act like a magnet for future price movements.
What is Fair Value Gap Pattern
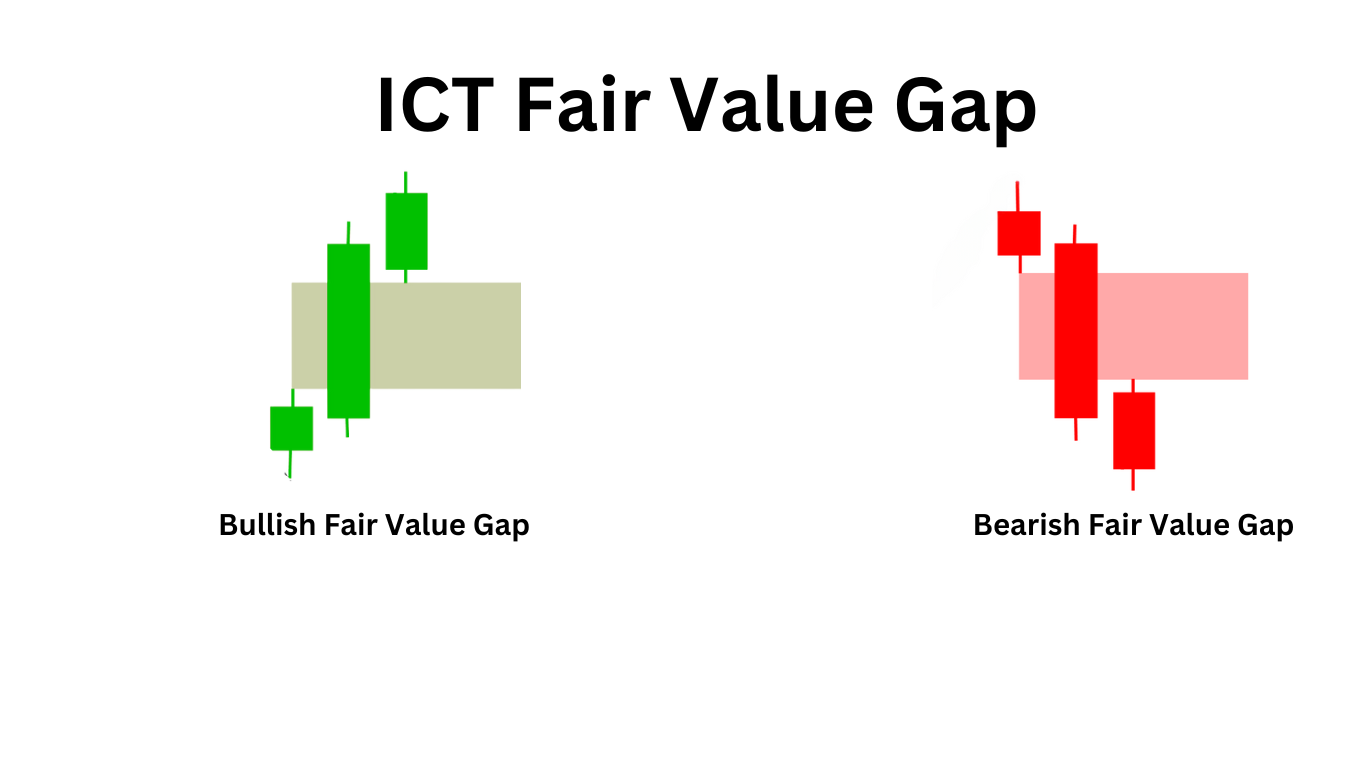
Fair Value Gaps (FVGs) typically form within a three-candle sequence on a chart. You can recognize an FVG when a large candle stands out, with the upper and lower wicks of the surrounding candles not extending fully into the body of this large candle.

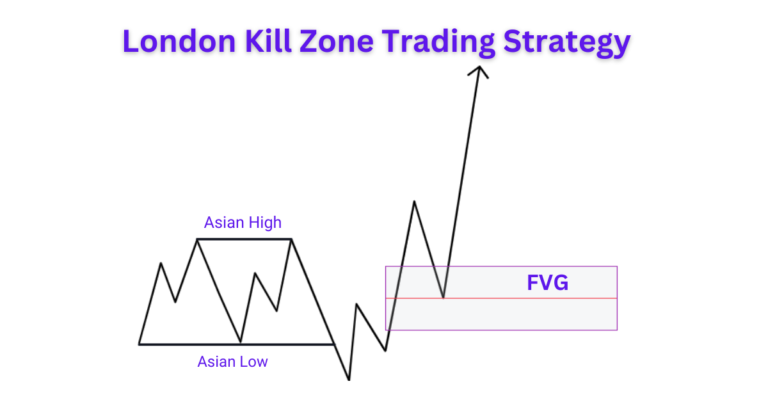
Fair Value Gaps (FVGs) can found on any timeframe and used by forex and crypto traders in various trading strategies. In this example, we’ll explore how to use FVGs to capitalize on trend continuation following a significant impulsive move.
After a strong price movement, it’s common to see the price return to an FVG before resuming the original direction of the impulse. Traders can leverage this by identifying FVGs on their charts and waiting for the price to revisit these areas. Once the price reaches the FVG, traders can enter a trade, aiming to benefit from the continuation of the trend.
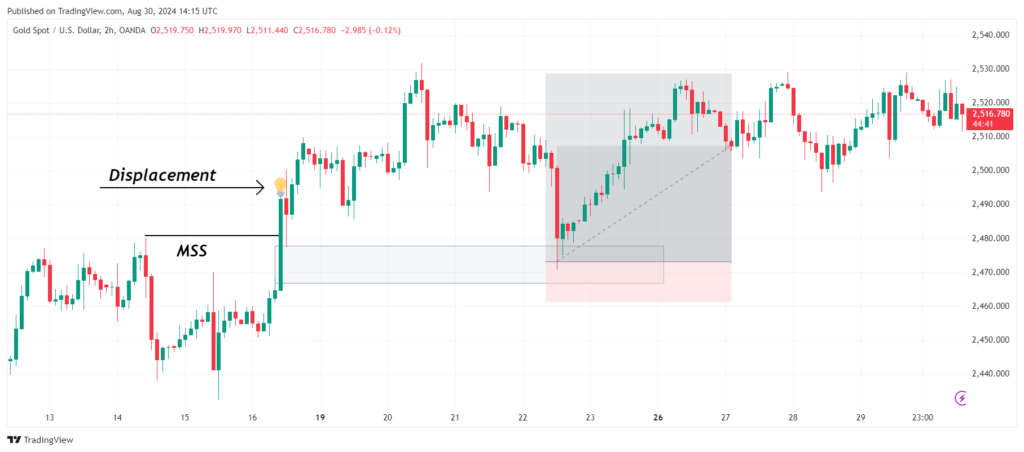
The XAUUSD chart above displays a Fair Value Gap (FVG) on a 2-hour timeframe. Initially, the price breaks through the structure with a significant displacement. Subsequently, it returns to fill the FVG before continuing to move upward.
What is meant by Displacement in ICT Fair Value Gap
Displacement occurs when a major market player with substantial capital enters the market with a strong intent to drive the price up or down rapidly. This results in a swift and significant price movement, often leaving behind Fair Value Gaps (FVGs) in its wake.
A displacement candle is a candle that breaks through a previous high or low. When there is displacement over structure, it means that the price has broken through a key level of support or resistance. Conversely, a lack of displacement occurs when the price fails to break through a previous high or low.
Liquidity Void Vs Fair Value Gap
| Aspect | Fair Value Gap (FVG) | Liquidity Void |
|---|---|---|
| Definition | A short-term imbalance in order flow, typically seen as a gap within a three-candle pattern, indicating a quick price shift due to uneven supply and demand. | A larger, more extensive imbalance resulting in significant price movements, often spanning multiple candles and reflecting a major market adjustment. |
| Scale | Localized, affecting a smaller timeframe and reflecting routine market fluctuations. | Broader, affecting larger portions of the chart and indicating a significant repricing event. |
| Visual Representation | Appears as a gap between three candles on the chart, signifying a swift adjustment in price. | Visible as sharp, substantial price movements without gradual trading activity in between. |
| Market Impact | Reflects minor shifts in market sentiment, leading to brief imbalances. | Indicates major market events or large trades that cause significant price changes. |
| Occurrence | Common, seen frequently in day-to-day trading. | Less frequent but more impactful, often following key events or market shifts. |
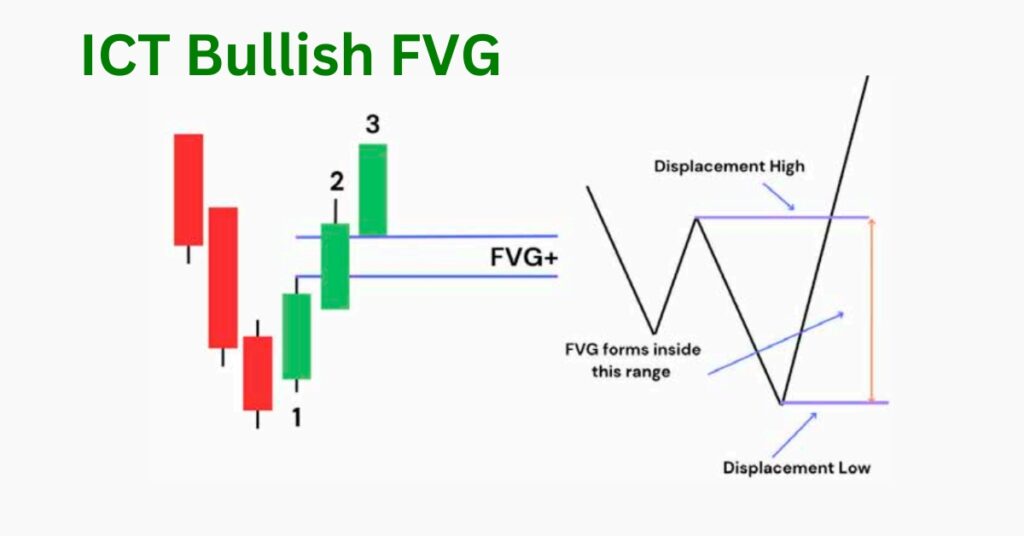
Bullish FVG With Example
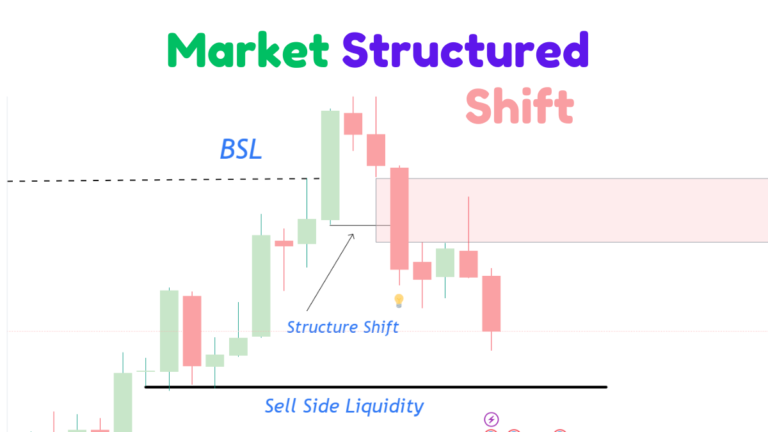
To trade a bullish fair value gap, first, wait for the price to sweep the sell-side liquidity. After this liquidity hunt, observe for a strong, energetic move that breaks the previous high, indicating a market structure shift. If this move leaves behind a fair value gap (FVG), prepare to execute trades when the price retraces to rebalance this gap.
The chart above illustrates a bullish fair value gap (FVG) trading scenario. Let’s consider another example using the GOLD/USD pair:
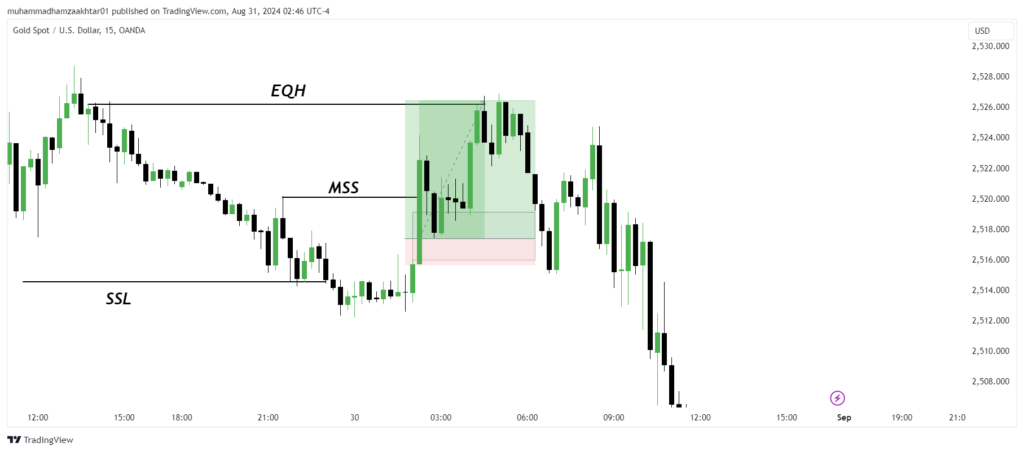
- Liquidity Sweep: The price sweeps sell-side liquidity at 2514.
- Break of Previous High: After sweeping the liquidity, the price breaks the previous high at 2520, creating a fair value gap.
- Revisiting the FVG: The market revisits the price level at 2517 within the FVG.
- Liquidity Hunt: Subsequently, the price hunts for liquidity again at 2526, as shown in the chart below.
Bearish Fair Value Gap
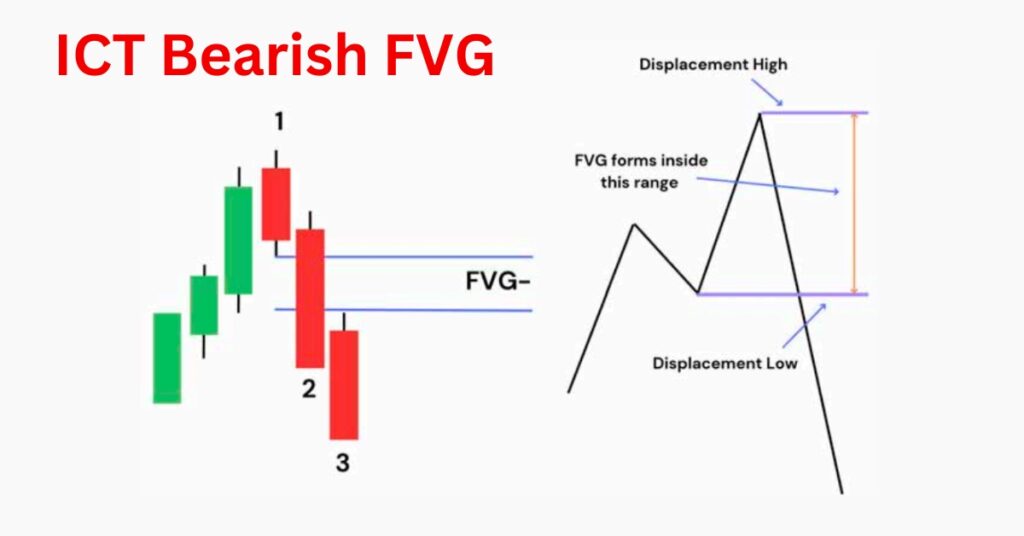
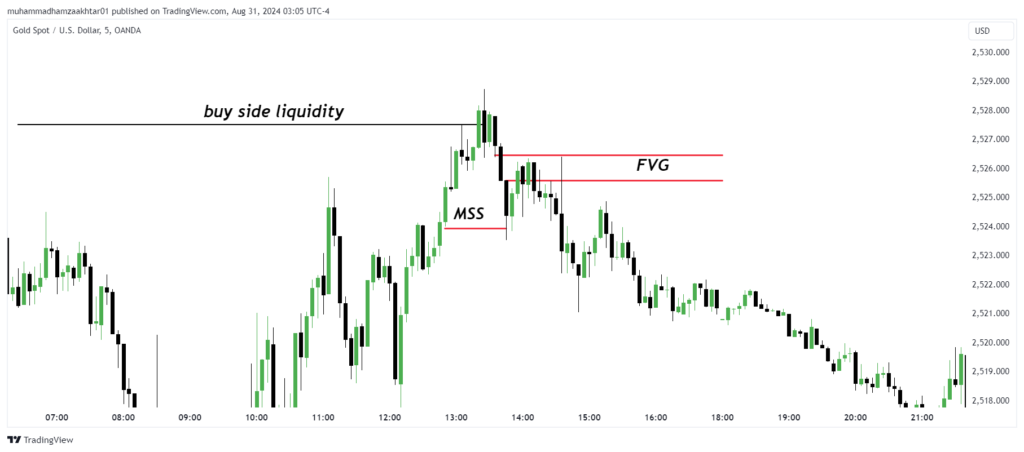
For trading a bearish fair value gap (FVG), start by waiting for the price to sweep buy-side liquidity. After this liquidity hunt, look for an energetic move that breaks the previous low, signaling a potential shift in market structure. Once the gap is created, execute your entry when the price revisits this FVG, as illustrated in the chart below.
Explained ICT Fair Value Gap Strategy (FVGs)
-
Identify a Liquidity Sweep:
Look for a sweep of liquidity where the market takes out key highs or lows, signaling potential trend exhaustion.
-
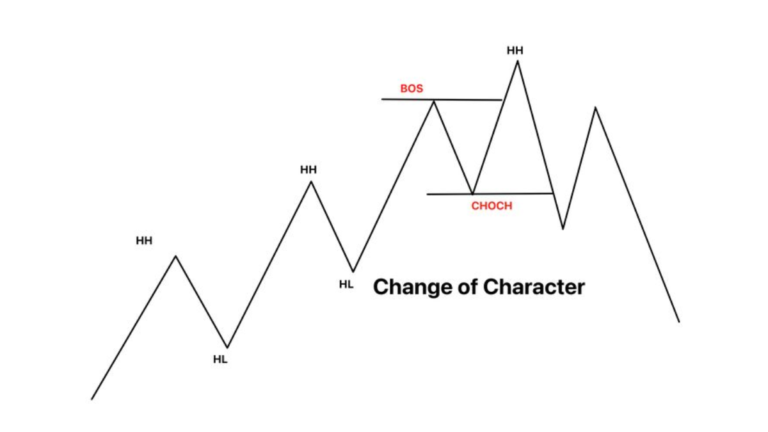
Observe a Market Structure Shift:
Wait for a clear break and close beyond a significant support or resistance level, indicating a possible trend change.
-
Identify a Price Imbalance (FVG):
Spot the Fair Value Gap, typically seen as a gap between three candles on the chart, representing an imbalance.
-
Wait for Price Retracement:
Monitor the price as it retraces towards the FVG, providing an opportunity to enter at a favorable level.
-
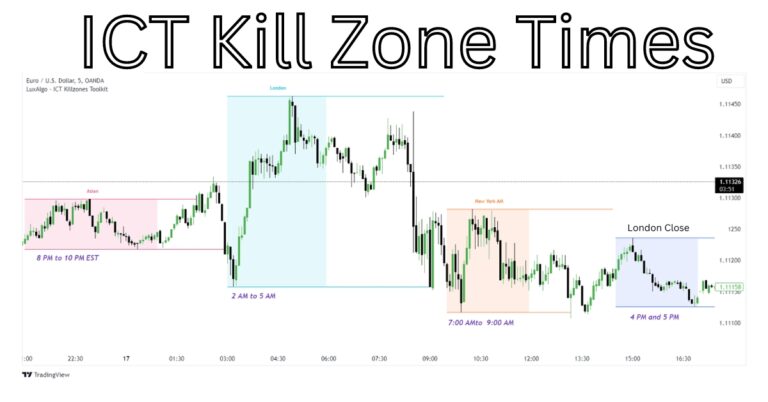
Seek Opportunities in Kill Zones:
Focus on finding setups during key trading sessions when market activity and liquidity are highest.

Helping Traders Scale to $10k/month in EUR/USD, GBP/USD, and E-mini S&P
With over 7 years of Forex market experience, Osama Asif is an expert in technical and fundamental analysis. Since 2024, he has been a key contributor to the ICT Trading platform. As a Certified Financial Risk Manager (FRM), Osama is passionate about precision and dedicated to guiding traders to achieve their financial goals in the Forex market.