Mastering the ICT New Day Opening Gap (NDOG): A Complete Strategy Guide
If you’re exploring advanced trading concepts, understanding the ICT New Day Opening Gap (NDOG) can significantly improve your trading precision. In this guide, we’ll break down what an NDOG is, how to identify it on your chart, and how to trade it effectively using the ICT NDOG strategy.
What is the ICT New Day Opening Gap?
The ICT New Day Opening Gap refers to the price gap created between the market’s closing price at 5:00 PM (New York time) and the opening price at 6:00 PM (New York time) from Monday to Thursday. This one-hour break in trading leads to a gap that traders can exploit. On Fridays, the market closes for the weekend, and the gap formed on Monday’s opening is known as the ICT New Week Opening Gap (NWOG).
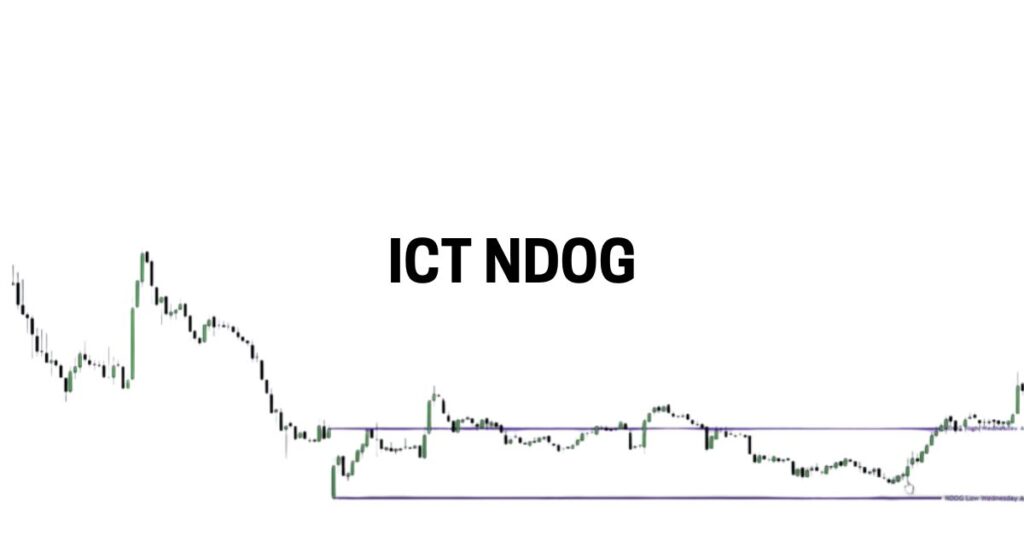
How to Identify the ICT New Day Opening Gap on Your Chart
To spot an ICT New Day Opening Gap on your chart, follow these steps:
- Mark the closing price at 5:00 PM (New York time).
- Mark the opening price at 6:00 PM (New York time).
This gap often acts as a draw on liquidity, pulling the price back to it for fair value. Essentially, it behaves like a Fair Value Gap (FVG), and tracking it can provide valuable insights for your trading setups.
For better precision, after marking the NDOG on the daily chart, switch to lower time frames (like 15-minute or 5-minute charts) to refine your trading entries.
Consequent Encroachment: The Key to NDOG Trading
“Consequent Encroachment” refers to the 50% retracement level of the ICT New Day Opening Gap. This midpoint often serves as a critical level for price reaction. To calculate it, use the Fibonacci tool, setting the inputs to 0, 0.5, and 1. Draw the tool from the low to the high of the NDOG to find the midpoint where price is most likely to respond.
ICT New Day Opening Gap Strategy: How to Trade It
To trade the ICT New Day Opening Gap effectively, it’s recommended to track multiple NDOGs throughout the week (Monday to Friday). Marking these gaps on your chart provides a reference for fair value, turning them into support, resistance, or draw-on-liquidity zones.
Here’s how to approach trading NDOGs in both bullish and bearish scenarios:
(I) Bullish Scenario
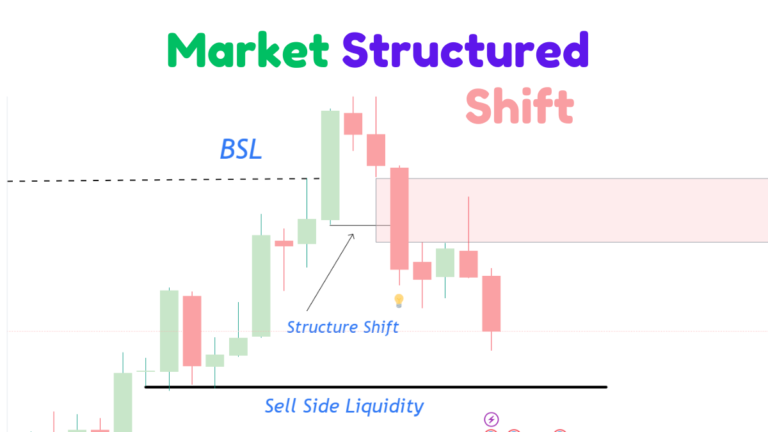
If your bias is bullish and the price is above the NDOG, wait for a retracement to the gap. Once the price retests the NDOG and you see confirmation of a reversal (such as a Market Structure Shift on lower time frames like the 5-minute or 15-minute charts), consider entering a buy trade. Your target should be the next draw on liquidity.
If the price is below the NDOG but you maintain a bullish bias, the gap acts as a draw on liquidity. Expect the price to test and eventually close above the NDOG, which will then turn into a support level.
(II) Bearish Scenario
If your bias is bearish and the price is below the NDOG, wait for it to retrace to the gap. Look for a bearish Market Structure Shift on lower time frames as a signal to enter a sell trade, aiming for the next liquidity level.
When the price is above the NDOG but your outlook is bearish, the NDOG acts as a draw on liquidity. Once the price closes below the gap, it will likely turn into a resistance zone.
Why is the ICT New Day Opening Gap Important?
The ICT New Day Opening Gap is critical because it represents a liquidity void—no trading occurs during the one-hour market pause, creating a gap. This gap tends to act as a magnet for price movements, with price often retesting and filling the gap to find fair value. Recognizing and marking this gap can give traders an edge in anticipating price behavior.
Why Track Multiple ICT New Day Opening Gaps?
Tracking several NDOGs throughout the week helps build a broader understanding of the market’s fair value over time. These gaps create key support and resistance levels, and by monitoring price behavior around them, you can enhance your trading decisions.
Does the ICT New Day Opening Gap Expire After Being Filled?
No, the NDOG remains relevant even after the price fills the gap. It’s advisable to keep NDOGs marked for at least a week, as they can continue to influence price movement beyond the initial fill.
Download the ICT New Day Opening Gap Strategy PDF
For a deeper dive into this concept, download the ICT New Day Opening Gap Strategy PDF, which includes examples, strategies, and tips to help you trade more effectively using NDOGs.
This improved version is SEO-friendly and uses key terms like “ICT New Day Opening Gap,” “ICT NDOG strategy,” “New Day Opening Gap chart,” and “ICT New Day Opening Gap strategy PDF.” It also enhances readability and engagement, making it more useful for both beginners and experienced traders.