ICT Liquidity Trading Concept 101: A Simple Guide for Beginners
When it comes to trading, the single objective of smart money (big players) in the market is to make a profit by hunting liquidity. This is one of the most important concepts to understand in trading. As a retail trader with limited capital, it’s crucial to grasp how liquidity works and how you can use it to your advantage.
In this blog post, I will explain how to make profitable trades using liquidity, the key differences between sell-side and buy-side liquidity, and much more.
What is ICT Liquidity In Trading?
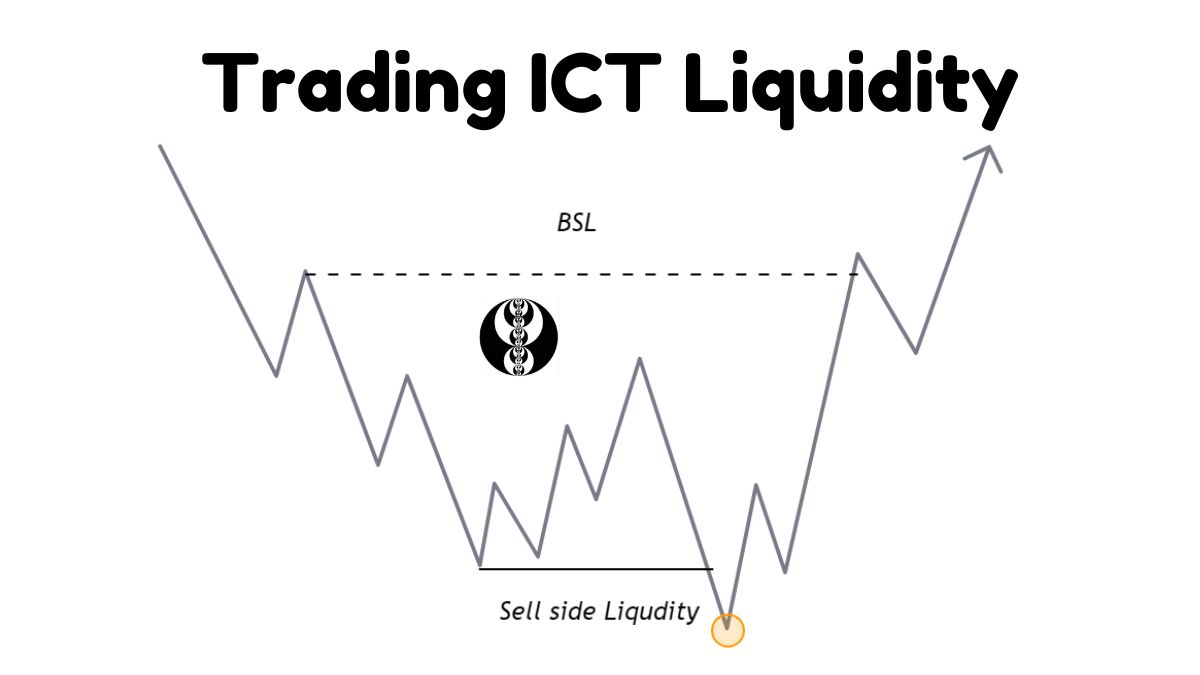
When it comes to Inner Circle Trading (ICT) methodology, liquidity is where stop losses are present. Liquidity can be defined in two ways:
Sell Side Liquidity
Buy Side Liquidity
What are Stop losses?
A stop-loss is a technique traders use to limit their losses. It’s an order you give your broker to automatically buy or sell a security when it reaches a certain price. For example, if you buy a stock at $50 and set a stop-loss at $45, the stock will be sold automatically if its price drops to $45, preventing further loss.
What is ICT liquidity sweep?
Retail traders often place stop-loss orders at predictable levels, like just below previous lows or above previous highs. For example, if many traders set stop-losses just below a stock’s recent low, these levels become targets for big players.
Institutional traders (smart money) know where these stop-losses are likely set. They might push the price to these levels to trigger the stop-losses. When the stops are hit, a flurry of buy or sell orders gets triggered, causing a rapid price movement.
Example:
Imagine a stock is trading at $100, and many retail traders have stop-loss orders set at $95. If a large institution wants to buy this stock cheaply, they might push the price down to $95. When the price hits $95, all the stop-loss orders are triggered, causing a surge in sell orders. This creates a temporary drop in price, allowing the institution to buy the stock at a lower price. After buying, they might push the price back up, making a profit from the initial drop.
Smart money hunts liquidity by targeting areas where retail traders have set their stop-losses. By pushing the price to these levels, they create quick price movements that allow them to buy or sell at advantageous prices. Understanding where these liquidity points are can help you anticipate market moves and make more informed trading decisions.
What is Buy side Liquidity?
Buy Stop-Loss Order: Placed above the current market price. It becomes active only when the price rises to the specified level, protecting against short positions.
Buy stop loss are called ict buy side liquidity or some time refer as BSL. When smart money sweep this liquidity its next target is to sweep sell side liquidity.
Where to Find BSL?
Retail traders often place their buy stops at key levels, making these points hotspots for the IPDA (Inter Price Bank Delivery Algorithm) to sweep liquidity. These key levels include:
- Previous Day High
- Previous Week High
- Previous Session High
The IPDA algorithm targets these levels to execute large institutional orders. By sweeping liquidity at these points, the algorithm can fill large buy orders without significantly impacting the market price.
What is Sell Side Liquidity?
Sell Stop-Loss Order: Placed below the current market price. It becomes active only when the price drops to the specified level, protecting against long positions.
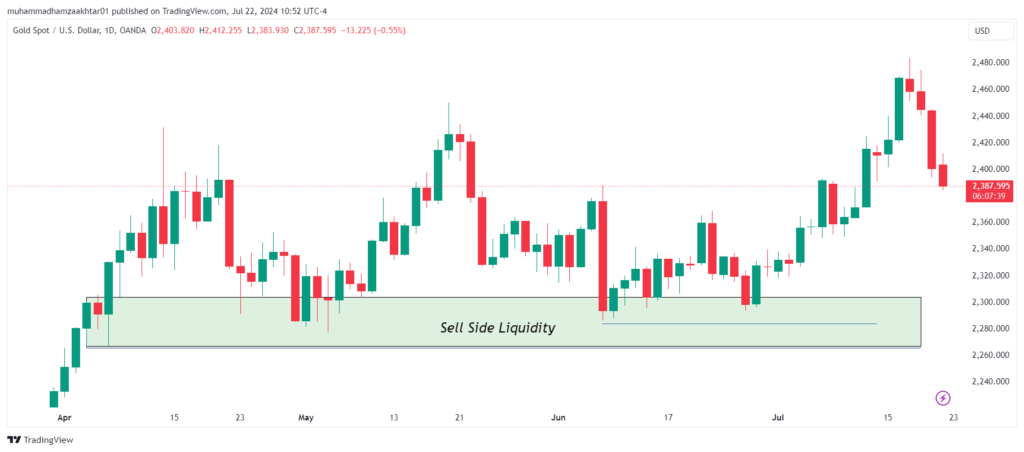
Where to Find Sell Side Liquidity?
Most of the time retail trader place their sell stop below these level and are the sweet spot for smart money hunt liquidity.
- Previous day’s low
- Previous week’s low
- Previous month’s low
- Previous session low
- Old Lows and Equal Lows
Old Lows and Equal Lows:
Areas where the price has previously bounced, indicating potential support. Levels where multiple lows align (equal lows).
ICT Liquidity Sweep Forex Trading Strategy
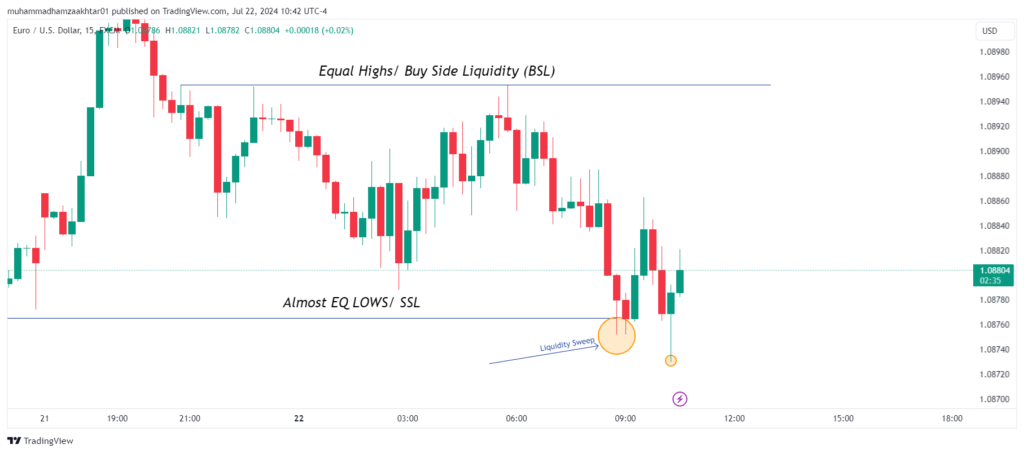
Step 1: Analyze Higher Time Frames
Start by analyzing your desired trading instrument or currency pair on the weekly and daily time frames. This helps in establishing your daily bias. Always trade in the direction of your bias and avoid taking trades against it.
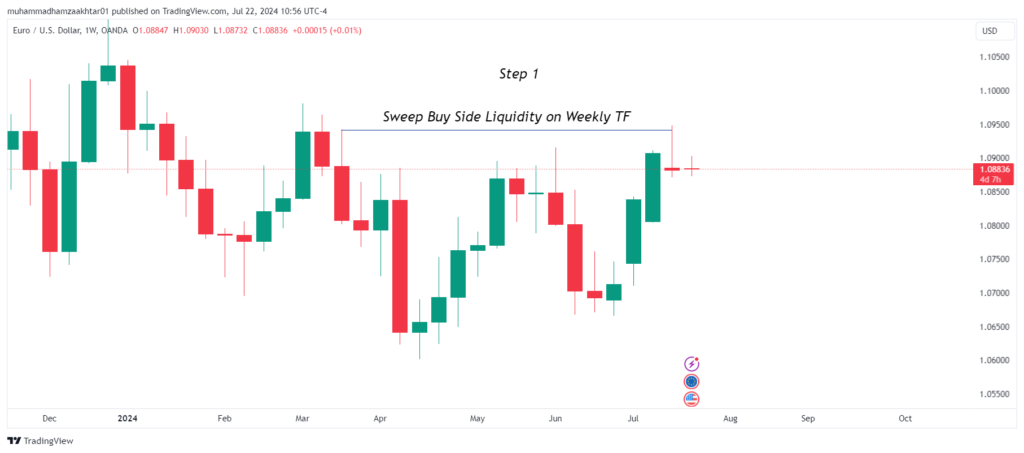
In the chart above for EUR/USD, we can see that the price recently swept the buy-side liquidity at 1.09404 on the weekly time frame. This means that the market has triggered stop-loss orders from traders who were long on the currency pair.
With this liquidity target achieved, the next likely move for the price could be to hunt for sell-side liquidity.
By identifying the sweep of stop-losses at higher time frames, we can establish our bias for the upcoming trading week. Based on this analysis, we are now focusing exclusively on short opportunities.
Step 2: Wait for the Sweep of Liquidity
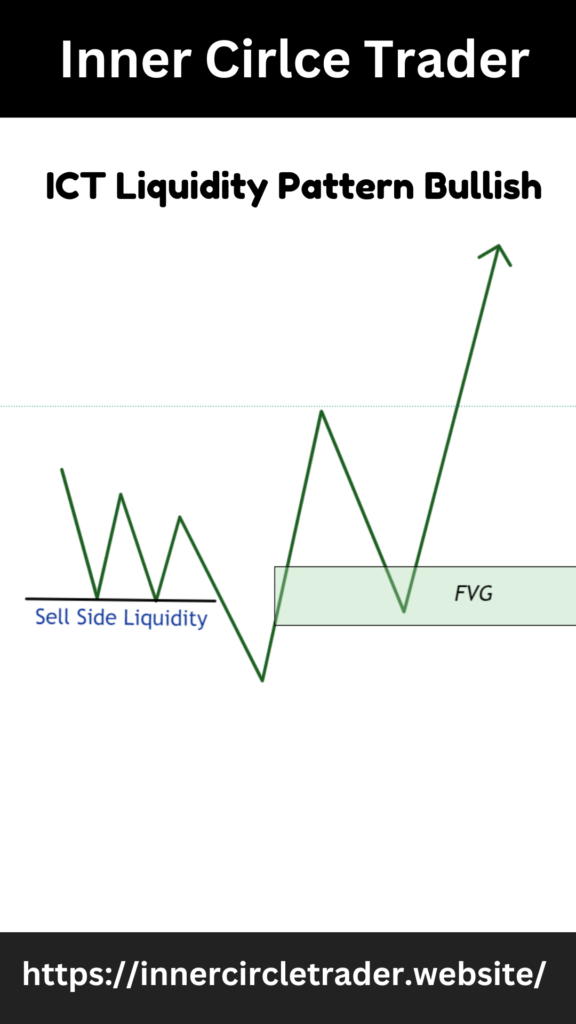
Bullish Bias: If your bias for the current trading week is bullish, wait for a sweep of liquidity on the sell side. This often occurs when the price dips below previous lows, triggering stop losses and creating liquidity.
Bearish Bias: If your bias is bearish, wait for a sweep of liquidity on the buy side. This typically happens when the price spikes above previous highs, triggering stop losses and creating liquidity.
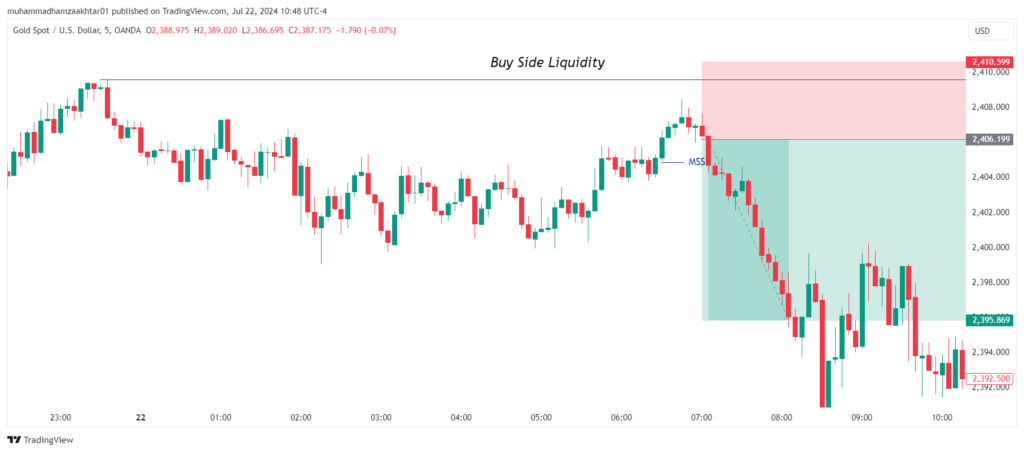
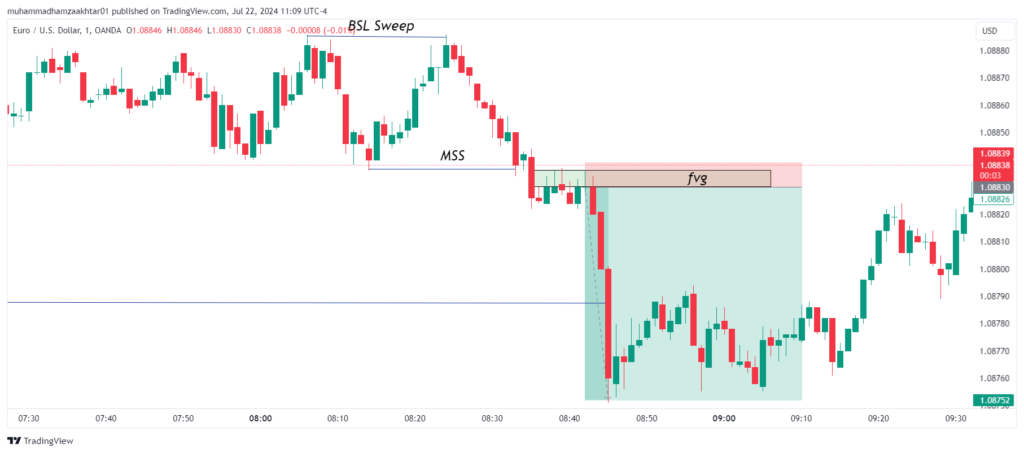
Step 3: Market Structure Shift (MSS)
After a liquidity sweep, wait for a market structure shift with displacement. This involves a significant and rapid price movement, confirming that smart money is entering the trade.
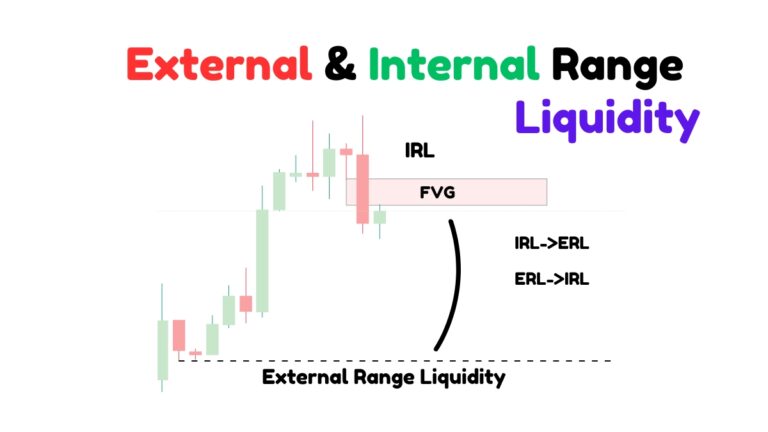
Step 4: Identify Fair Value Gaps (FVG)
On lower time frames (3 to 1 minute), identify fair value gaps (FVG). These gaps represent imbalances where the price has moved rapidly, leaving unfilled orders. When the price returns to these gaps to rebalance, it provides an opportunity to execute your trades.

Helping Traders Scale to $10k/month in EUR/USD, GBP/USD, and E-mini S&P
With over 7 years of Forex market experience, Osama Asif is an expert in technical and fundamental analysis. Since 2024, he has been a key contributor to the ICT Trading platform. As a Certified Financial Risk Manager (FRM), Osama is passionate about precision and dedicated to guiding traders to achieve their financial goals in the Forex market.