ICT OTE (Optimal Trade Entry) Levels and Trading Strategy
ICT OTE (Optimal Trade Entry)levels are helpful tools for trading in a trending market. These levels utilize specific Fibonacci zones to execute trades effectively.
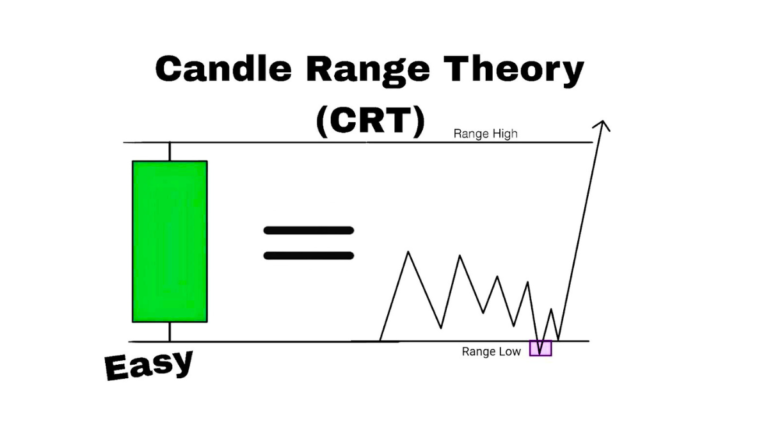
Markets do not move steadily in one direction. In a bullish market, the price does not only move upward. If that were the case, the market would collapse, and no one would be able to profit. Instead, the market experiences ups and downs while trending.
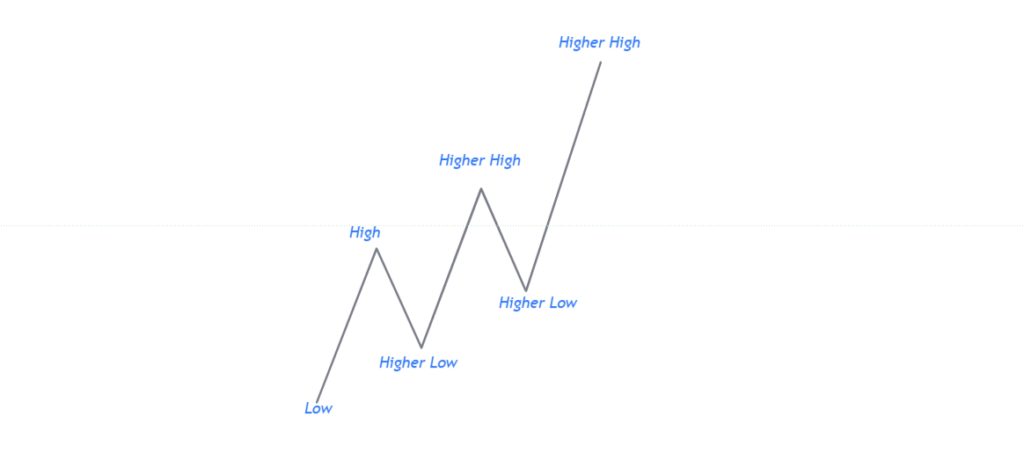
In a bull run, the market moves upward by forming higher highs and higher lows. Conversely, in a bearish market, the price moves downward by forming lower lows and lower highs.
When the market retraces, these ICT OTE levels provides traders an opportunity to execute their trades.
What are ICT OTE Levels?
Optimal Trade Entry (OTE) patterns are specific Fibonacci levels. In a trending market, the price respects these levels, providing traders with opportunities to execute their trades.
Fibonacci Retracement Levels
| Level | Description |
|---|---|
| 0 | First Profit Scale |
| 0.5 | Equilibrium (OTE Zone) |
| 0.618 | Golden Zone (OTE Zone) |
| 0.705 | OTE |
| 0.786 | Golden Zone (OTE Zone) |
| 1 | Starting Position |
| -0.5 | Target 1 |
The Optimal Trade Entry (OTE) zone uses specific Fibonacci retracement levels to identify good trading opportunities.
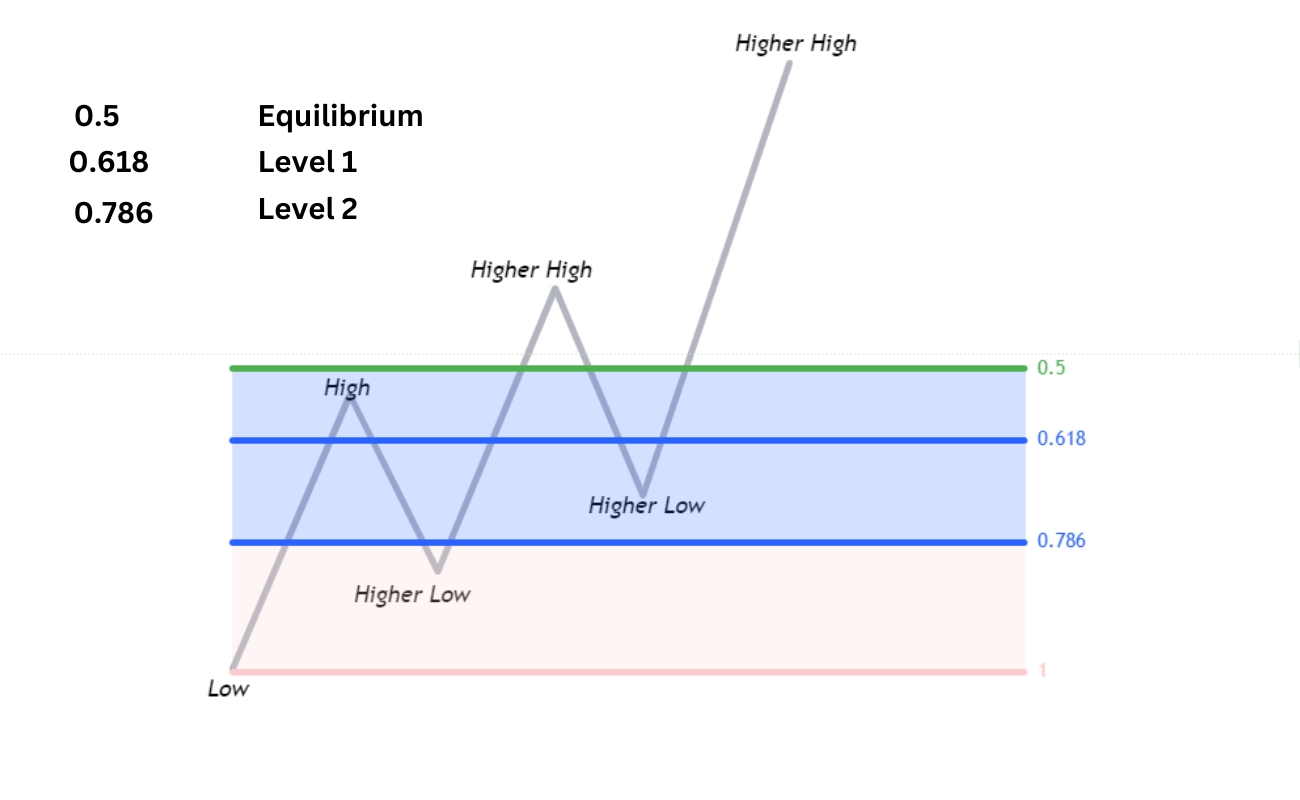
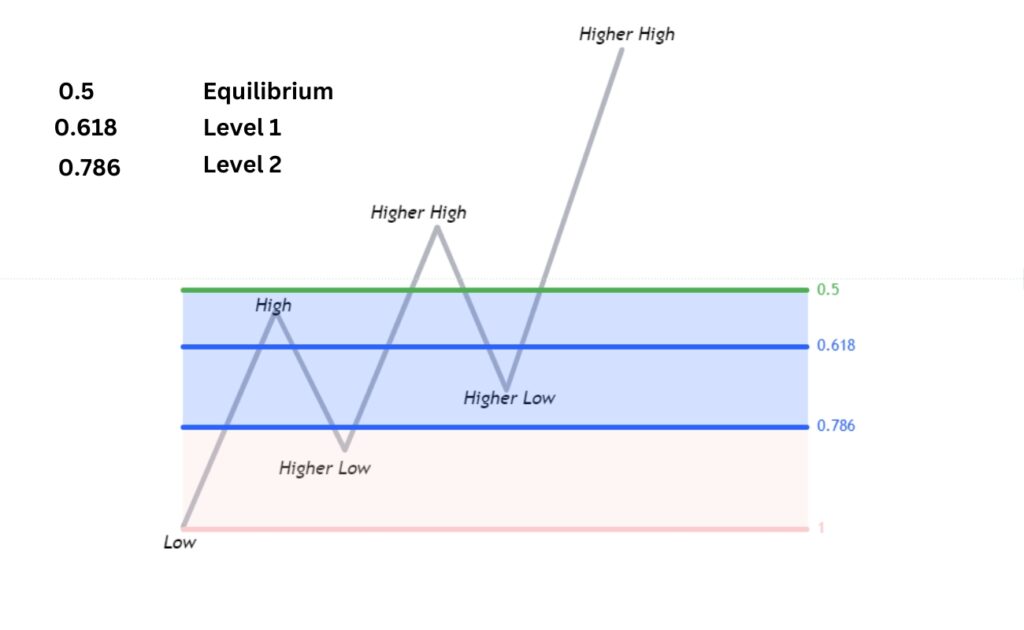
- OTE Levels: The main optimal trade entry levels are 0.5, 0.618, and 0.786.
- Golden Zones: The 0.618 and 0.786 levels are called golden zones most of the time market respects these levels.
- Best Risk to Reward: Executing trades when the price retraces to these levels typically offers the best risk-to-reward ratio.
ICT Fib OTE Settings?
Optimal Trade Entry (OTE) Fibonacci settings are used to find the best points to enter a trade.
- Open Trading View and select your chart.
- Add Fibonacci Retracement: Click the Fibonacci tool on the left toolbar.
- Draw the Fibonacci Levels: Click at the swing low and drag to the swing high (or vice versa).
- Adjust Levels:
- Double-click the Fibonacci retracement tool.
- Go to Settings.
- Add/modify levels:
- 0: First Profit Scale
- 0.5: Equilibrium
- 0.618: Golden Zone
- 0.705: OTE
- 0.786: Golden Zone
- 1: Starting Position
- -0.5: Target 1
- Click “OK” to apply.
Trading Strategy.
Confirming Market Trend and Executing Trades
1. Confirm Market Trend
- Analyze Higher Time Frames:
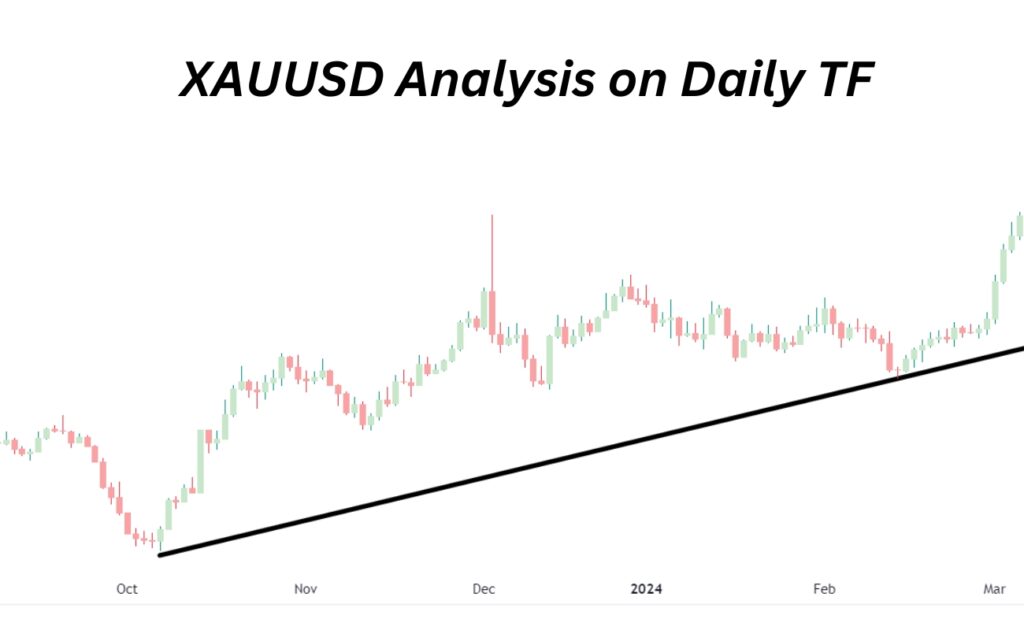
- Daily Chart:
- Identify Trend: Look for patterns indicating whether the market is in an uptrend (bullish) or downtrend (bearish). In an uptrend, the market typically forms higher highs and higher lows. In a downtrend, you will see lower highs and lower lows.
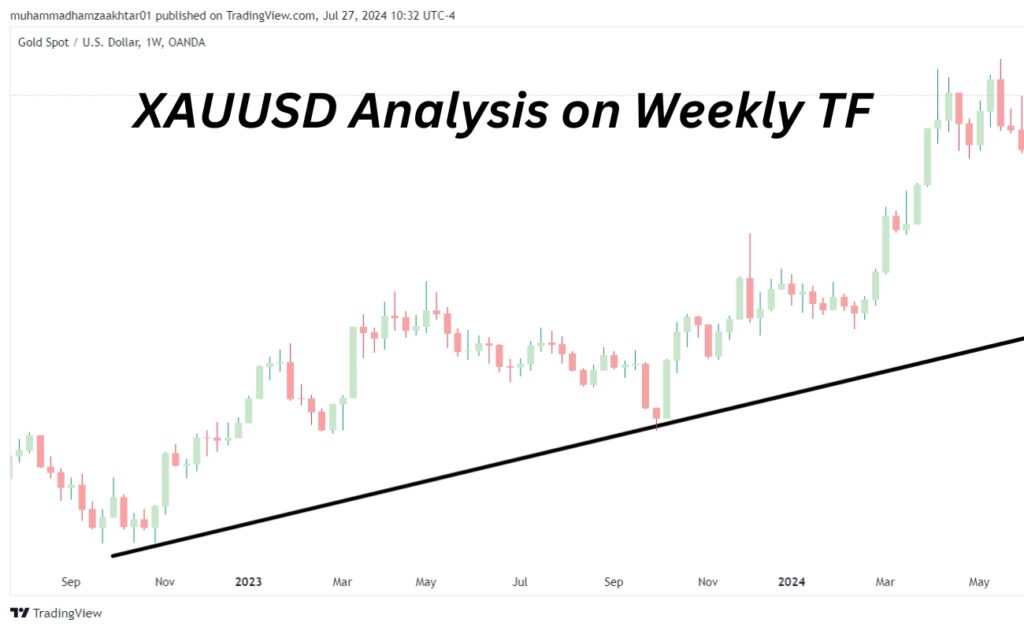
- Weekly Chart:
- Confirm Trend Direction: Use the weekly chart to verify the overall market trend observed on the daily chart. This longer time frame helps you understand the broader market movement and ensures that your daily trend analysis aligns with a longer-term perspective.
2. Intraday Trading
- Switch to Lower Time Frames:
- 15-Minute Chart:
- Focus on Precision: Use the 15-minute chart to identify more precise entry points within the broader trend. This time frame helps you spot short-term price movements and fine-tune your trades.
- Look for Price Retracements:
- Wait for the price retracement on these levels in ICT Kill Zone time. Time is most important factor when trading with inner circle trader concepts.
- Execute Trades:
- Enter at Optimal Points: Once the price reaches the retracement levels and shows signs of following the higher time frame trend, execute your trades. This alignment with the broader trend enhances the probability of successful trades.
Bullish Market Example
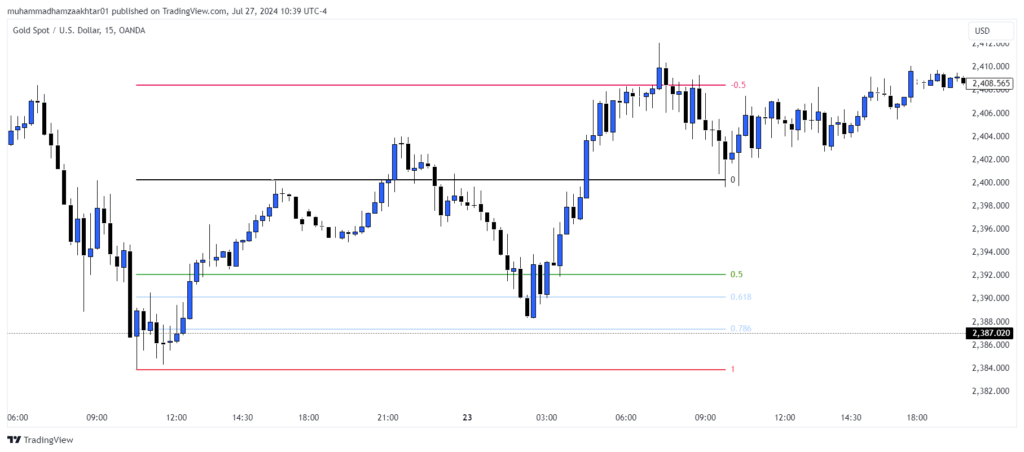
The chart of XAUUSD above illustrates the application of Fib Optimal Trade Entry (OTE) within a bullish trend. The price retraced to the golden Fibonacci zones, respecting these levels before reaching the -0.5 target level.
Bearish Market Example of OTE
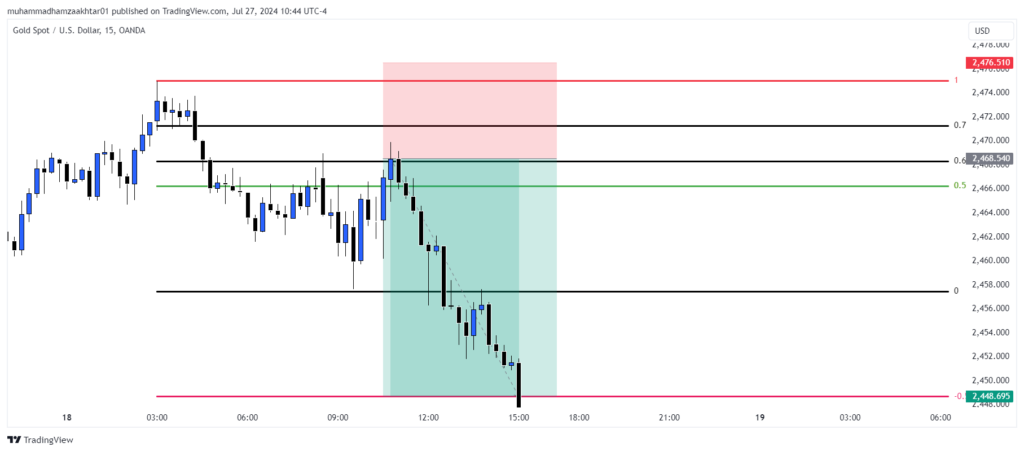
The chart of XAUUSD (Gold) shows a short trade scenario where the price respected the Fibonacci levels and achieved the -0.5 level as the take-profit target.
Where to Place Stop Loss
- Short Trades: Place the stop-loss a few pips above the 1.0 Fibonacci level.
- Long Trades: Place the stop-loss a few pips below the 1.0 Fibonacci level.
What is the significance of the 0.5 Fibonacci level in the Optimal Trade Entry (OTE) setup?
In the Optimal Trade Entry (OTE) setup, the 0.5 Fibonacci level is important because:
Equilibrium Point: It’s the halfway mark of the previous price move.
Support/Resistance: It often acts as support in an uptrend or resistance in a downtrend.
Entry Signal: Traders use it to spot potential trade entries when the price respects this level.
Risk Management: It’s used to set stop-loss orders to limit potential losses.
Overall, the 0.5 level helps identify potential entry points and manage trades.
Which Fibonacci level is used as a target in the ICT OTE trading strategy?
In the OTE trading strategy, the -0.5 Fibonacci zones is used as the target. This level is where traders aim for their price to reach, often marking a point where they can take profits from their trades.
Why are the 0.618 and 0.786 levels referred to as golden zones in the OTE setup?
In the OTE setup, the 0.618 and 0.786 Fibonacci levels are referred to as golden zones because:
High Respect: These levels are often where the price shows strong respect and can reverse or continue in the direction of the overall trend.
Optimal Entry: They are considered ideal zones for entering trades because they provide high probability entry points with a favorable risk-to-reward ratio.
Historical Effectiveness: Historically, these levels have been effective in predicting significant price reversals and continuations.
These factors make the 0.618 and 0.786 levels key areas to watch in the ICT OTE strategy.

Helping Traders Scale to $10k/month in EUR/USD, GBP/USD, and E-mini S&P
With over 7 years of Forex market experience, Osama Asif is an expert in technical and fundamental analysis. Since 2024, he has been a key contributor to the ICT Trading platform. As a Certified Financial Risk Manager (FRM), Osama is passionate about precision and dedicated to guiding traders to achieve their financial goals in the Forex market.