Internal and External (ERL&IRL) Liquidity in Forex? Complete Trading Guide With Example
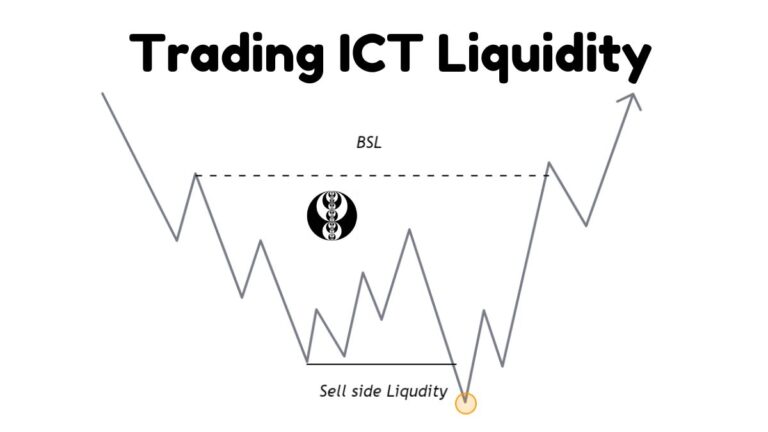
Liquidity is a fundamental driver of price movements on charts. Smart money strategically targets liquidity, whether on the sell or buy side liquidity.
Understanding internal and external range liquidity is crucial when making trading decisions based on liquidity.
What is External Range Liquidity In Forex?
External range liquidity (ERL) is a concept that revolves around the accumulation of stop-loss orders at old highs and lows. These points are critical in technical analysis and trading strategies because they act as strong support and resistance levels.
Most important point for finding ERL are
Previous Day High and Low Previous Session High and Low Equal High and Lows Weekly High and Low Monthly High and Low
What is ICT Internal Range Liquidity?
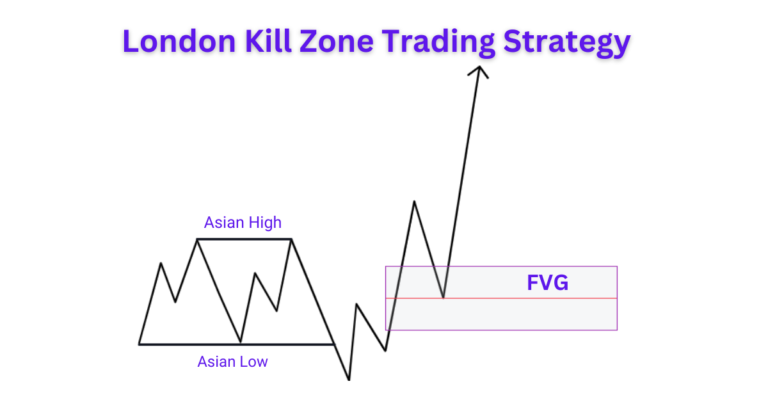
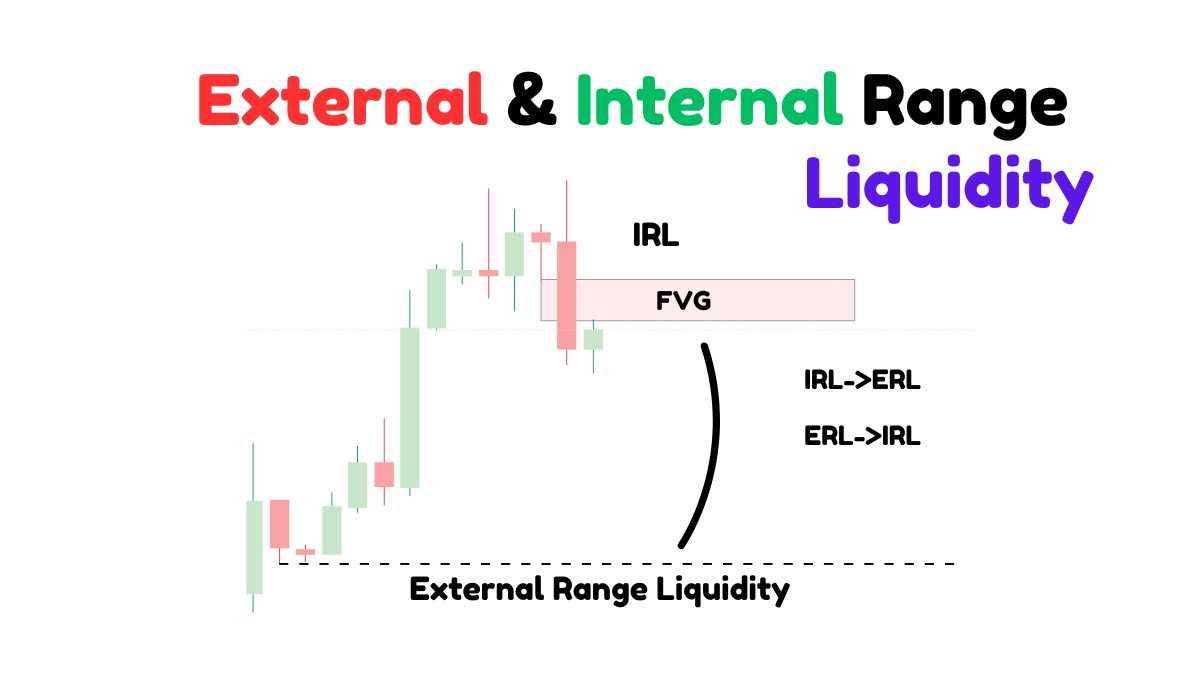
Internal Range Liquidity is visible in the form of gaps when the price moves rapidly in one direction. The most important gap on the chart is the Fair Value Gap, which is identified by a three-candlestick pattern. Retail traders often open their trades in the direction of these gaps, typically placing their stop losses at the midpoint of the gaps.
Retail traders generally believe these gaps are formed due to imbalances in supply and demand zones, assuming that the price will not return to fill these gaps. However, in reality, the price often retraces to these gaps for repricing, allowing smart money to profit by triggering the stop losses of retail traders.
How to Trade ERL and IRL?
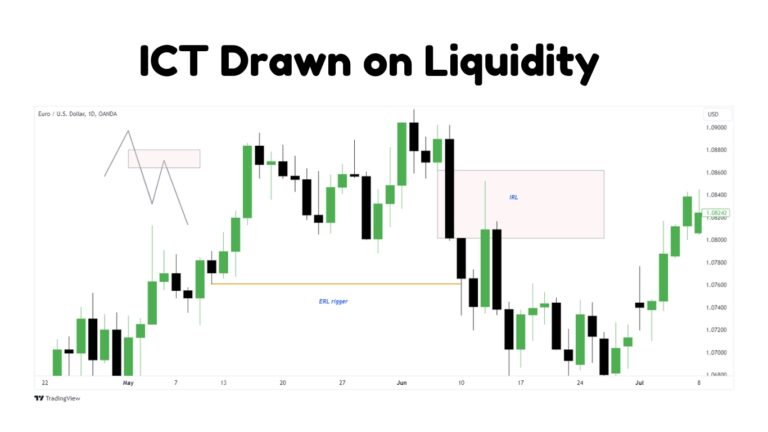
Price moves from IRL to ERL and From ERL to IRL.
Start by analyzing the chart from a higher timeframe to determine the current position of the price.
Identify Price Location:
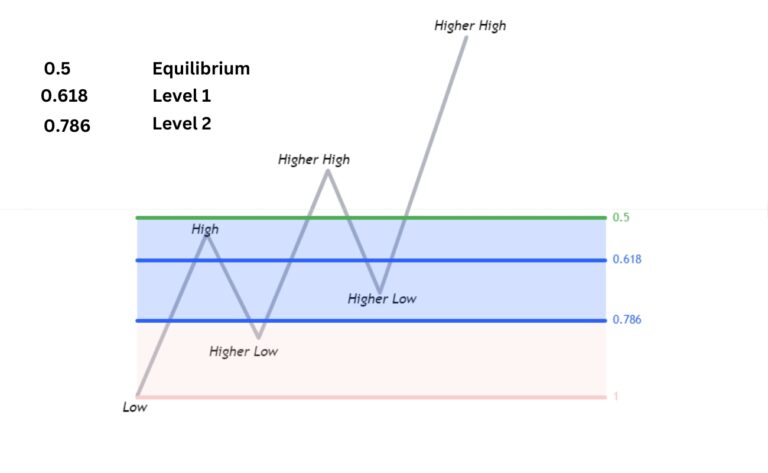
Examine whether the price is within the Internal Range Liquidity (IRL). This is where short-term highs and lows are found, indicating areas of concentrated liquidity within the range.
If the price is in the IRL, set the next target as the External Range Liquidity (ERL). This is the highest high or lowest low of the range, representing key levels of liquidity outside the current range.
If the price sweeps liquidity from the ERL, meaning it has reached and possibly exceeded the ERL, then shift the target back to the IRL. This indicates a potential reversal or consolidation area.
By using this method, you can identify setups on lower timeframes that align with the targets established from higher timeframe analysis. This approach helps in making informed trading decisions based on the movement between internal and external range liquidity levels.
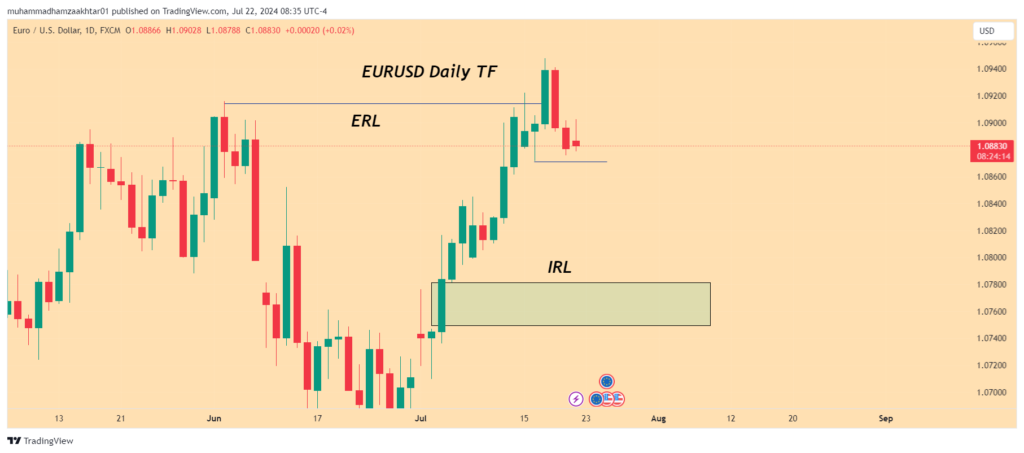
Example
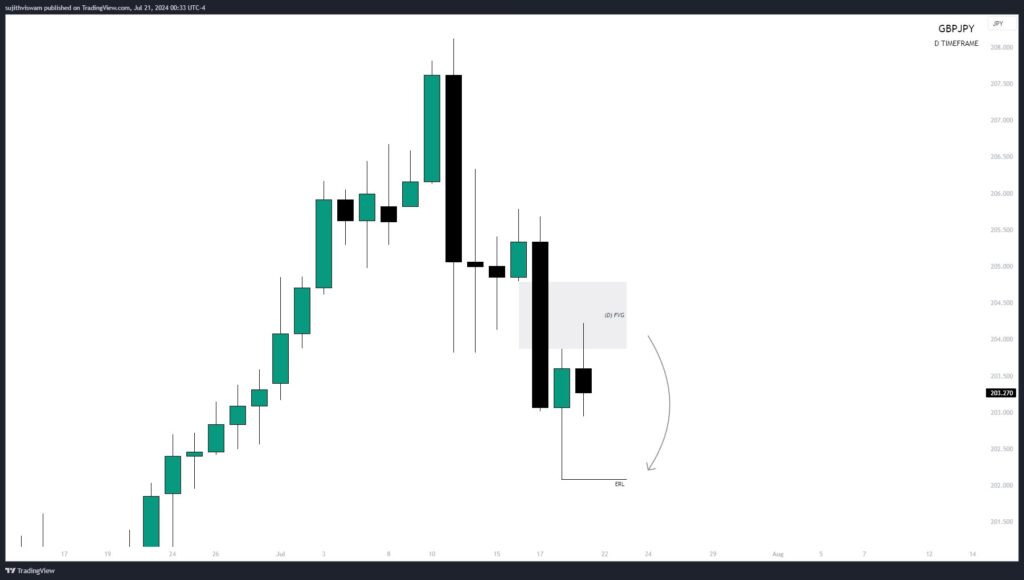
We start by higher timeframe candles. Look for any higher timeframe candle of your choosing, such as 1 hour. 4 hour, daily or weekly
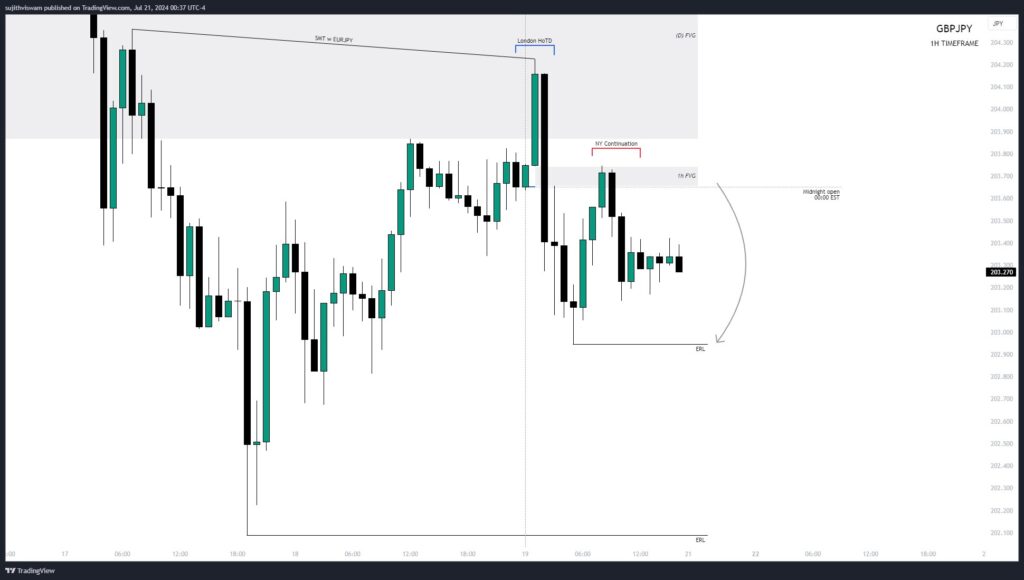
Drop to appropriate lower timeframes for such as 4h is 5min. Daily 15m or 1 hour, Weekly 1 hour
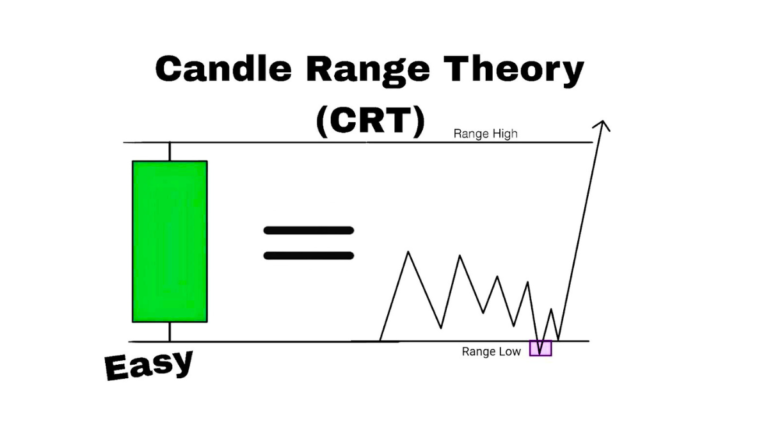
If a candle closes bullish. Most likely it’s high will be hunted and if it closes bearish most likely it’s low will get hunted. We will use those highs and lows for draw on liquidity purposes. We’re either targeting low or high of that htf candle.
You’ll look for structure shift and fair value gap to happen in appropriate lower timeframes according to what your higher timeframe is.

Helping Traders Scale to $10k/month in EUR/USD, GBP/USD, and E-mini S&P
With over 7 years of Forex market experience, Osama Asif is an expert in technical and fundamental analysis. Since 2024, he has been a key contributor to the ICT Trading platform. As a Certified Financial Risk Manager (FRM), Osama is passionate about precision and dedicated to guiding traders to achieve their financial goals in the Forex market.