What is Inter Bank Price Delivery Algorithm and Data Ranges
In the world of Forex trading, price movements may seem random to the untrained eye. However, seasoned traders know that market dynamics follow specific patterns driven by institutional forces. One such framework that helps decode these movements is the Interbank Price Delivery Algorithm (IPDA).
This article explores the core principles of IPDA and how traders can leverage IPDA data ranges to anticipate market trends and improve their trading strategies.
What is the Interbank Price Delivery Algorithm in Forex Trading?
The IPDA is a sophisticated framework that outlines how prices are delivered in the Forex market.
Imbalance: This refers to a significant disparity between buyers and sellers in the market. When there’s an imbalance, prices will move to correct it. For instance, if there are more buyers than sellers, prices will rise until the imbalance is resolved.
Liquidity: Liquidity denotes the presence of active market participants willing to buy and sell. Price movements often target liquidity zones, such as previous highs and lows, where retail traders have placed their stop-loss orders. These liquidity pools are frequently sought by institutional traders or smart money.
At its core, the IPDA dictates that price movements are driven either by the need to balance market imbalances or by the hunt for liquidity. This understanding is crucial for traders who wish to anticipate future price movements.
What are IPDA Data Ranges
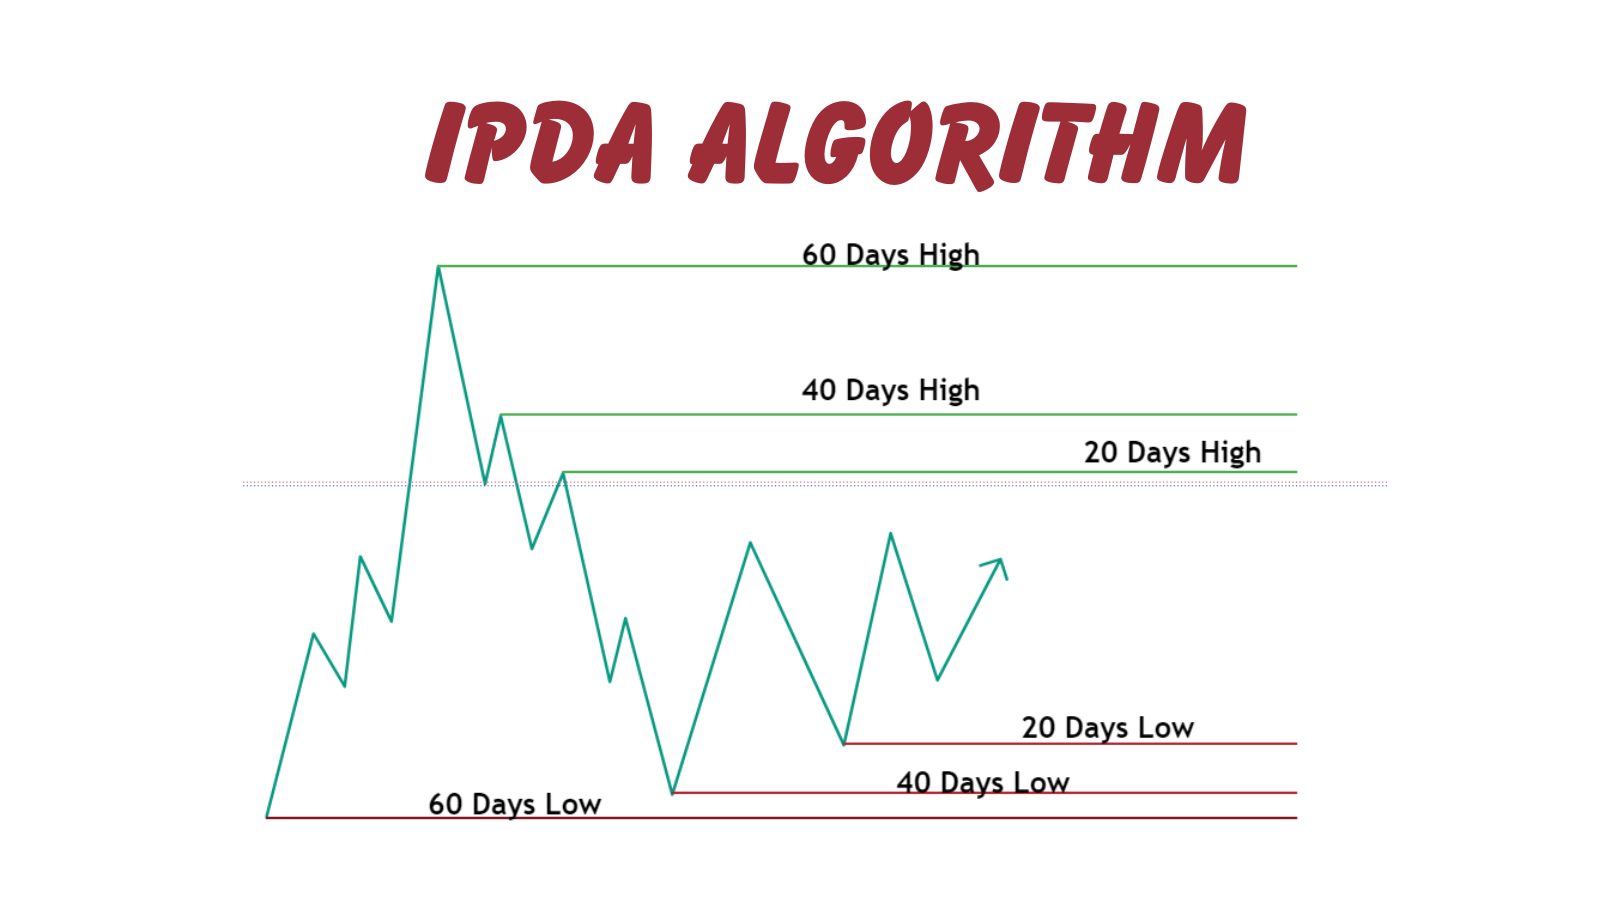
One of the most powerful tools traders can use is IPDA Data Ranges, which focus on analyzing historical price movements over specific periods. These data ranges are instrumental in identifying significant price levels and predicting future trends. Traders typically use 20, 40, and 60-day look-back periods to forecast market conditions.
20-Day Look-Back Period
This period is ideal for intraday traders who want to spot short-term imbalances and trading opportunities. By analyzing the price action over the last 20 trading days, traders can identify key levels where the market may react.
40 and 60-Day Look-Back Periods
For swing traders, the 40 and 60-day look-back periods provide a broader perspective on market trends. These periods help identify larger market swings and institutional price levels, making them more suitable for traders looking to hold positions over several days or weeks.
IPDA controls how prices are delivered on the chart with the primary goal of maximizing profits for smart money. By analyzing the price delivery within the previous 20, 40, and 60 days (IPDA data ranges), you can see how the algorithm targets liquidity and rebalances price imbalances (FVG). Lets deeper looks into the working of IPDA.
How to Utilize IPDA Data Ranges Effectively
To fully capitalize on IPDA data ranges, traders should follow these key steps:
- Daily Time Frame Analysis: Start by analyzing the daily time frame, excluding weekends, to accurately count trading days within the chosen look-back period. This gives you a clear picture of market conditions over the last 20, 40, or 60 days.
- Marking Highs and Lows: Use a ruler tool or other measuring instruments to mark the highest high and lowest low for each look-back period. These price points are crucial as they often represent key areas where the market may reverse or accelerate.
- Quarterly Adjustments: Markets undergo shifts every quarter, requiring traders to adapt their strategies accordingly. By observing these quarterly market behaviors, traders can better anticipate consolidations or retracements and adjust their trading strategies to align with the new market conditions.
One of the key benefits of using the IPDA and data ranges is the ability to forecast the direction of the weekly candle and determine potential higher or lower price targets. By combining IPDA data ranges with Premium and Discount (PD Arrays), traders can develop a clearer bias for the upcoming week’s price movement.
For instance, if the market is in a strong uptrend and liquidity resides above the current price level, traders can anticipate that the price will likely seek out that liquidity in the upcoming sessions, confirming a bullish bias.
Trading Strategy
- Identifying Key Price Points: At the beginning of each month, find out the highest and lowest price points from the past 20, 40, and 60 days. These points are crucial for spotting where significant price changes might occur.
Developing a Trading Bias
- Evaluating the Market’s Position: Check if the current price is higher (premium) or lower (discount) compared to usual:
- High Prices (Premium): If prices are high, it might be a good time to sell as prices might fall soon.
- Low Prices (Discount): If prices are low, it might be a good time to buy expecting prices will rise.
Identifying Key Trading Areas
- Spotting Equal Highs and Lows: Look for price points that have been hit multiple times. These are often where a lot of buy or sell orders are placed, and big players in the market might target these to trigger price movements.
- Finding Price Imbalances: Find the price imbalance on the chart for possible entry into the trade.
Example of Short Trade Using IPDA Algorithm data ranges
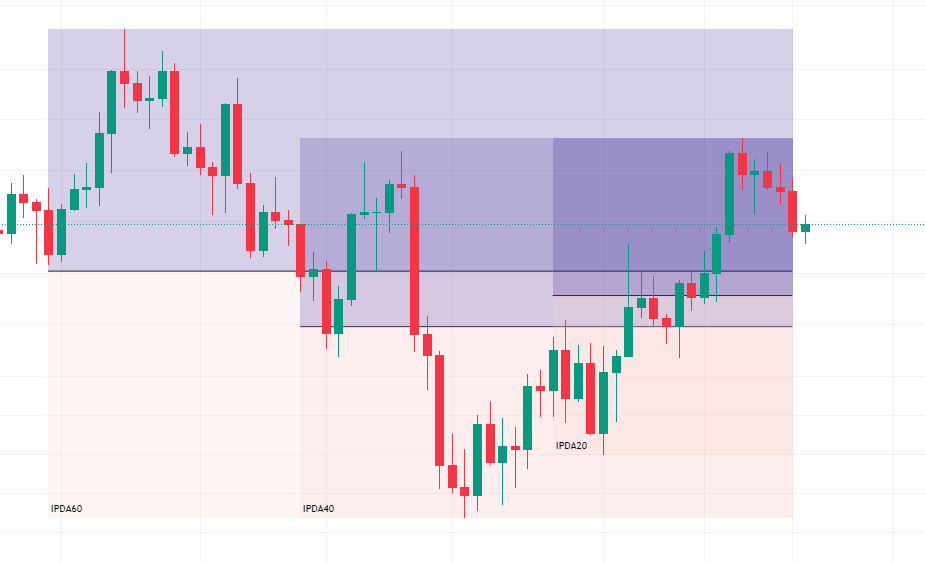
The above image show the price of EURUSD in previous 20,40 and 60 days. The price is in premium zone and next possible drawn on liquidity is at 1.07572. So its the ideal condition to take short trades. For entering into the short position move toward the lower time frame hourly and find imbalance as shown on the image below.

The above image is show the possible entry into the short position on the filling of imbalance.
Adjusting Strategy According to Trading Style
For Long-Term Trading: Use daily charts to look at price movements over the last 60 days to help predict what might happen next. Pay attention to major economic news that could affect the market.
For Medium-Term Trading: If you’re a swing trader, focus on 4-hour charts and review the past 15 days to understand recent market trends.
For Day Trading: Use 15-minute charts and focus on what’s happened in the last three days to spot immediate trading opportunities.
What is an IPDA data range?
IPDA data ranges involve studying the price action from the past 20, 40, and 60 days. This analysis helps traders identify the next draw on liquidity and pinpoint institutional reference points for executing trades. Essentially, it is a method to understand what smart money is doing and anticipate their next moves.
What is the IPDA algorithm?
The Interbank Price Delivery Algorithm (IPDA) is a sophisticated trading algorithm used primarily by institutional investors, often referred to as “smart money,” to influence market prices
What is the IPDA market cycle?
The Interbank Price Delivery Algorithm (IPDA) creates shifts on the daily chart every 20, 40, and 60 trading days, known as the IPDA look-back periods. Approximately every 20 trading days, new liquidity pools form on both sides of the market based on ICT (Inner Circle Trader) concepts.
Is the Inter Bank Price Deliver Algo Strategy Used in Scalping?
Yes, the IPDA strategy can be used in scalping due to the fractal nature of price movements. What happens on higher time frames also occurs on lower time frames. This makes the IPDA strategy adaptable to scalping and other trading styles. For scalping, focus on the 15-minute time frame and analyze the price action from the previous three days to find trading opportunities.

Helping Traders Scale to $10k/month in EUR/USD, GBP/USD, and E-mini S&P
With over 7 years of Forex market experience, Osama Asif is an expert in technical and fundamental analysis. Since 2024, he has been a key contributor to the ICT Trading platform. As a Certified Financial Risk Manager (FRM), Osama is passionate about precision and dedicated to guiding traders to achieve their financial goals in the Forex market.